STR investment analysis for Zillow, Redfin & Realtor.com

Know if a listing is a
good STR investment

Paste any Zillow, Redfin, or Realtor.com listing and instantly see projected Airbnb revenue, cap rate, cash-on-cash return, and local STR regulations — before you make an offer. No install needed.

Free to start · 3 analyses/month · No credit card · or get the free Chrome extension
🏠 STRInvest
Live Analysis
1402 Ocean Dr · 3bd/2ba · $485,000
Analyzing STR potential
Done ✓
STR Investment Analysis
📅 Est. Annual Revenue $62,400
📊 Cap Rate 8.4%
💰 Cash-on-Cash Return 11.2%
🏨 Avg Nightly Rate $287
✓ STR Permitted in this area
🏆 STRONG INVESTMENT
4
weekends of Airbnb data averaged
6
investment metrics calculated
100+
US cities with STR regulation data
$0
free to start
How it works
From a listing link to a decision
1

Paste a listing URL

Copy any property link from Zillow, Redfin, or Realtor.com and paste it in. STRInvest pulls the address, bedrooms, and list price — no install, no spreadsheet.

2

Get your investment scorecard

STRInvest searches Airbnb for comparable listings in the same zip code, averages real weekend and midweek pricing, and returns cap rate, cash-on-cash return, monthly cash flow, breakeven nightly rate, and local STR regulations.

3

Save, compare & monitor

Save deals to your portfolio, compare them side by side, export to CSV, share a report link — and get an email when a saved listing's price drops or its STR rules change.

Features
Everything you need to
make the buy/skip decision
📊
Real Airbnb market data
Pulls live pricing from 20–40 comparable Airbnb listings in the same zip code — not estimates, actual market data averaged across 4 upcoming weekends.
💰
Full investment scorecard
Cap rate, cash-on-cash return, monthly cash flow, down payment, mortgage payment, and breakeven nightly rate — calculated instantly from the list price.
⚖️
STR regulation lookup
Instantly see whether STRs are permitted, require a permit, restricted, or banned in that city — covering 100+ US markets where investors actually buy.
🏘️
Airbnb comparable listings
See the actual nearby Airbnbs your property would compete against — with photos, nightly rates, ratings, and direct links to each listing.
⚙️
Adjustable assumptions
Change the down payment, interest rate, occupancy rate, or expense ratio and recalculate instantly — without re-fetching Airbnb data.
💼
Portfolio, compare & CSV
Save every deal to your account, sort your pipeline by cap rate, compare properties side by side, and export the whole thing to CSV.
🔔
Price-drop & rule-change alerts
STRInvest re-checks your saved listings and emails you when a price drops or a city's STR rules change — so the work keeps happening after you close the tab.
🔗
Shareable deal reports
Send a partner or lender a clean public link to any analysis, or print it to PDF — no login required to view.
📥
Bulk analyze
Paste up to 15 listing URLs at once and get them all back ranked by cap rate — built for agents and serious investors screening a market.

How does STRInvest calculate short-term rental investment returns?

STRInvest uses a four-input methodology to estimate cap rate and cash-on-cash return. The nightly rate is set at the P45 (45th percentile) of comparable active Airbnb listings in the same zip code with the same bedroom count — a conservative market rate that accounts for the fact that most new listings don't command top-tier prices immediately.

Occupancy is assumed at 68% — the national average annual occupancy for short-term rentals according to AirDNA's 2024 market data. Expense ratio is set to 35% of gross revenue, covering property management, cleaning, maintenance, insurance, and supplies. The mortgage payment uses a 30-year amortization at prevailing interest rates, calculated from the listed purchase price and a 20% down payment assumption.

All four inputs are adjustable. Change your down payment percentage, target occupancy rate, local expense ratio, or interest rate and the cap rate, cash-on-cash return, and monthly cash flow figures update instantly — without re-fetching Airbnb data.

STRInvest calculates STR investment returns using P45 nightly rate from live Airbnb comps, 68% occupancy (national STR average), 35% expense ratio, and 30-year mortgage math. All assumptions are adjustable. It runs on the web (paste any Zillow, Redfin, or Realtor.com link) with an optional Chrome extension, and covers STR regulations for 100+ US cities.

How does STRInvest compare to AirDNA for STR investment research?

AirDNA is a standalone market data platform starting at ~$40/month that provides historical revenue analytics, occupancy trends, and seasonality data for STR markets. STRInvest is a lighter, cheaper web app: paste any Zillow, Redfin, or Realtor.com link and get cap rate, cash-on-cash return, cash flow, and local STR rules from live Airbnb comps — then save the deal, compare it, and get alerted when the price drops. It runs in any browser (with an optional free Chrome extension), for a fraction of AirDNA's price.

Feature STRInvest AirDNA
Where it worksAny browser — paste a Zillow/Redfin/Realtor.com link (+ optional extension)Separate platform (airdna.co)
Data sourceLive Airbnb search resultsHistorical database + forward estimates
Investment metricsCap rate, CoC return, cash flow, breakevenRevenue estimates, occupancy, ADR
STR regulations100+ US cities includedNot included
PriceFree / $9.99/month~$40+/month

What you'll see

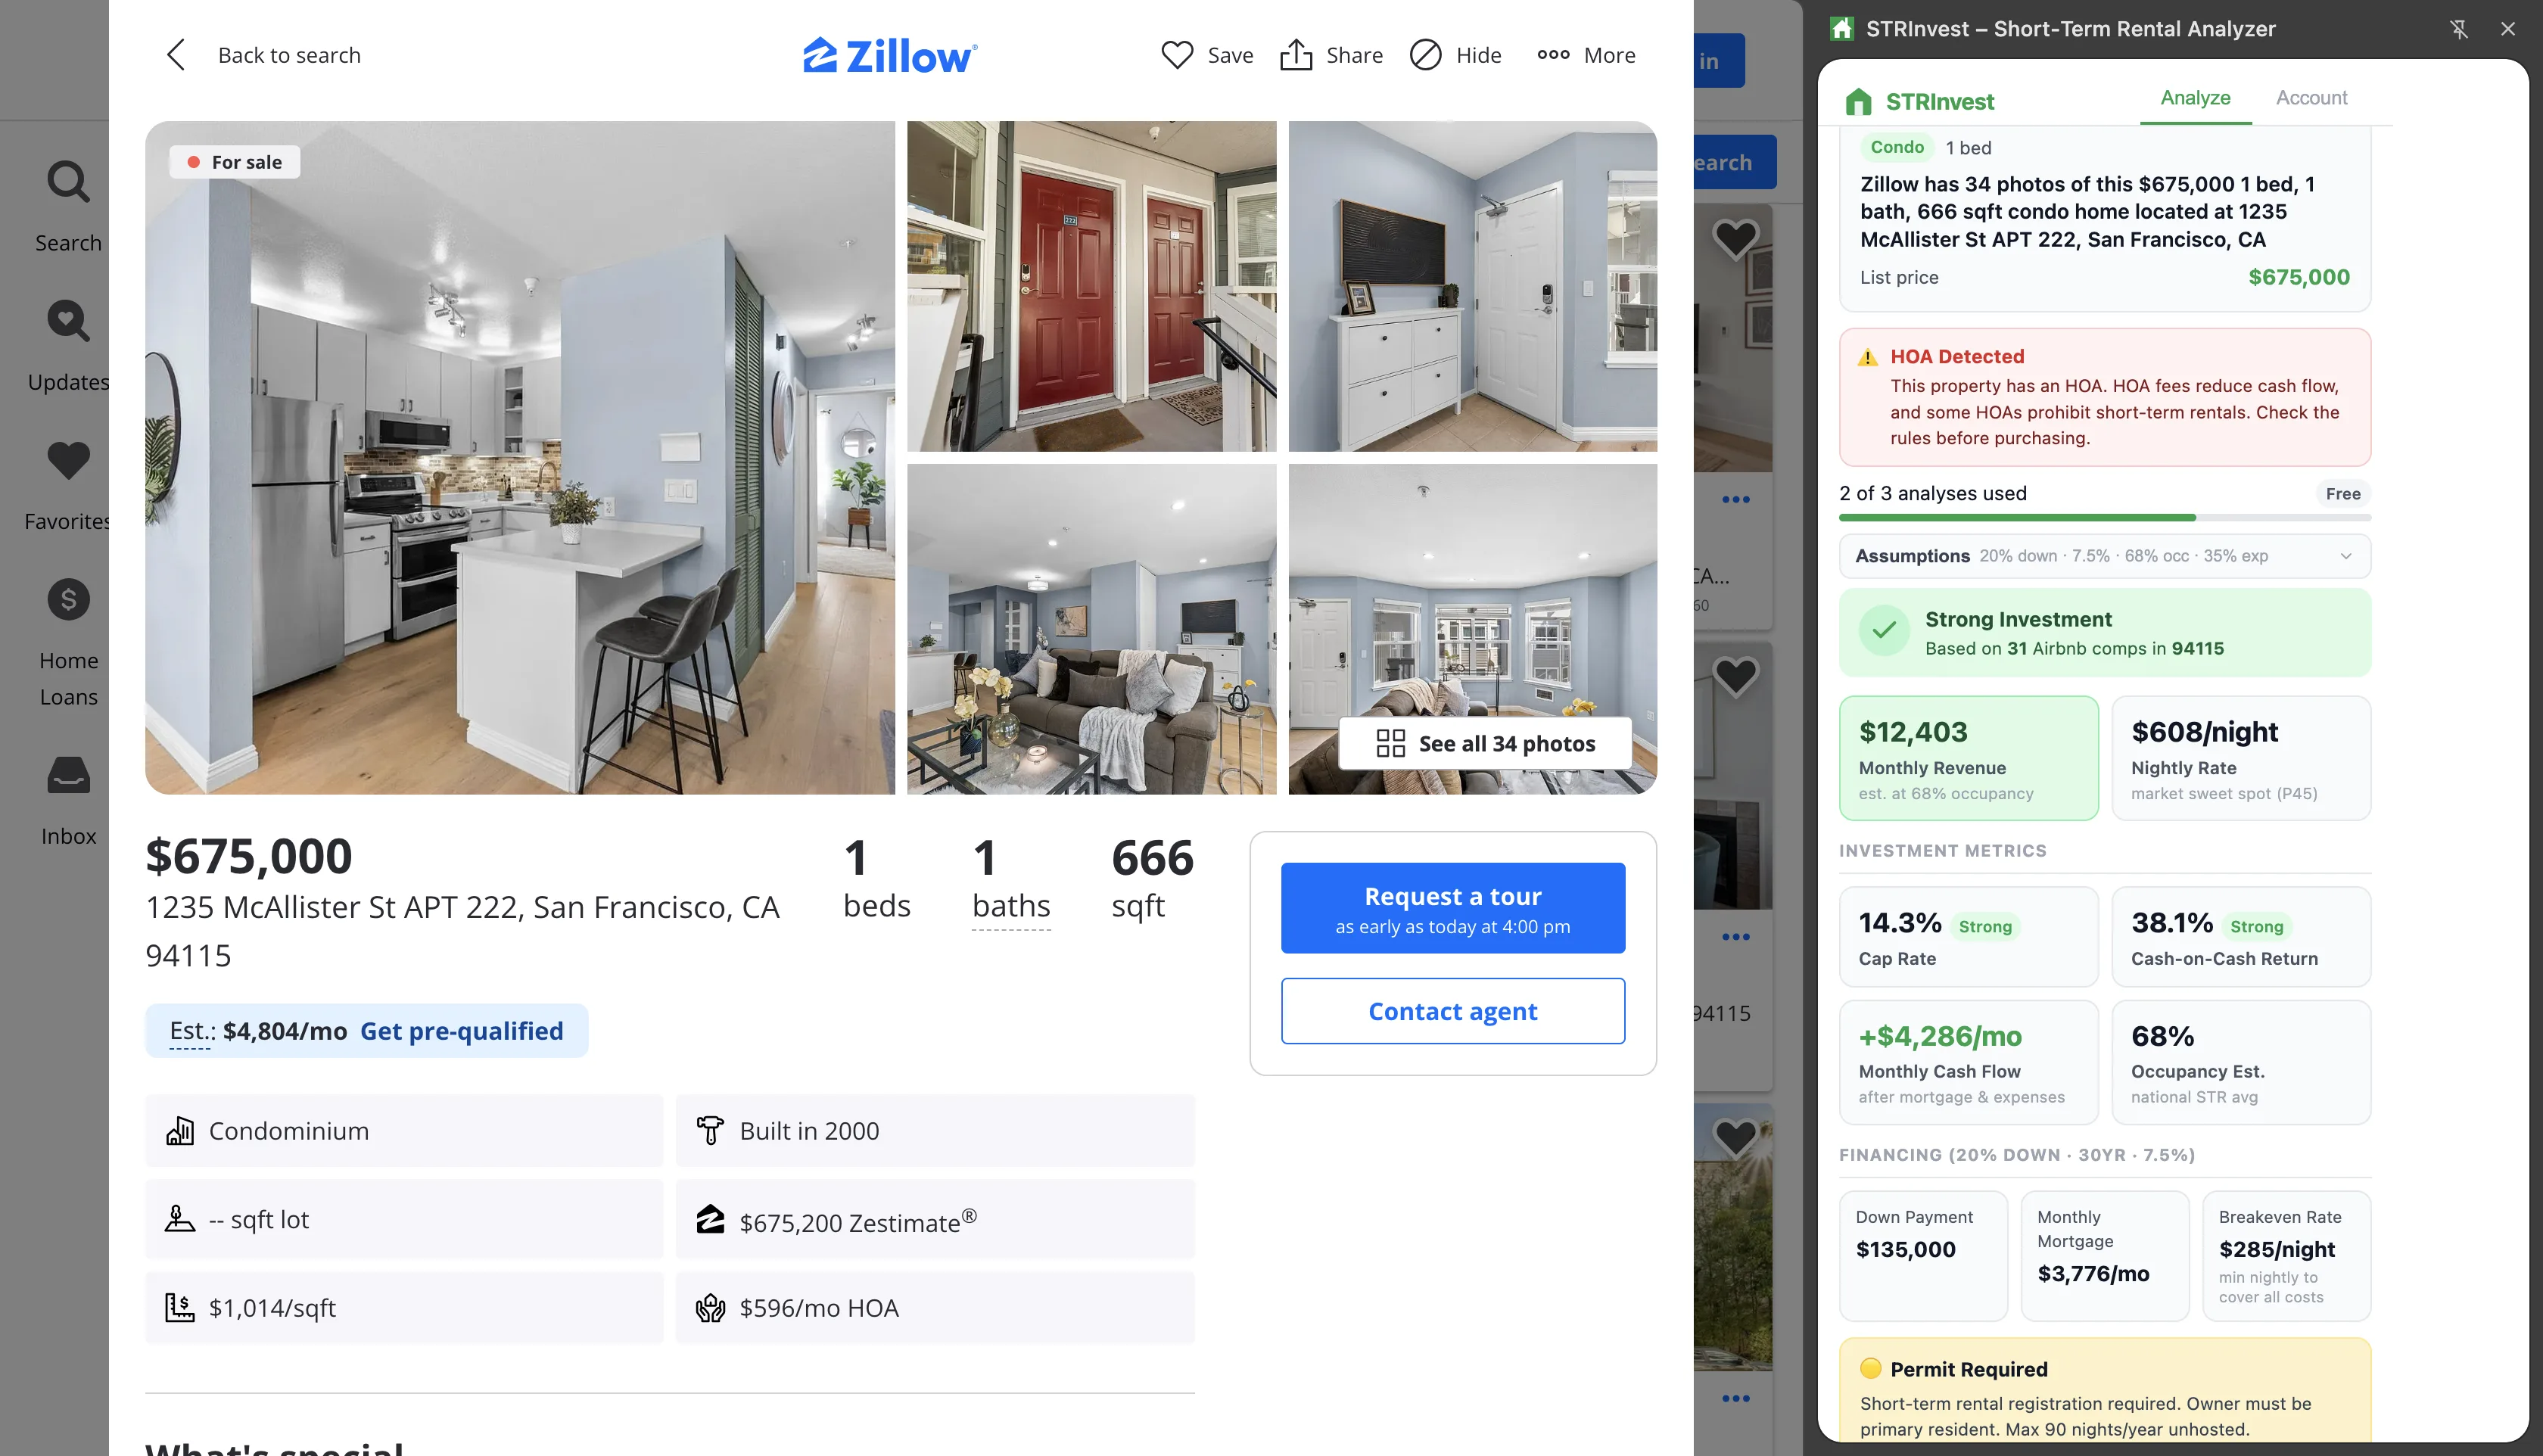
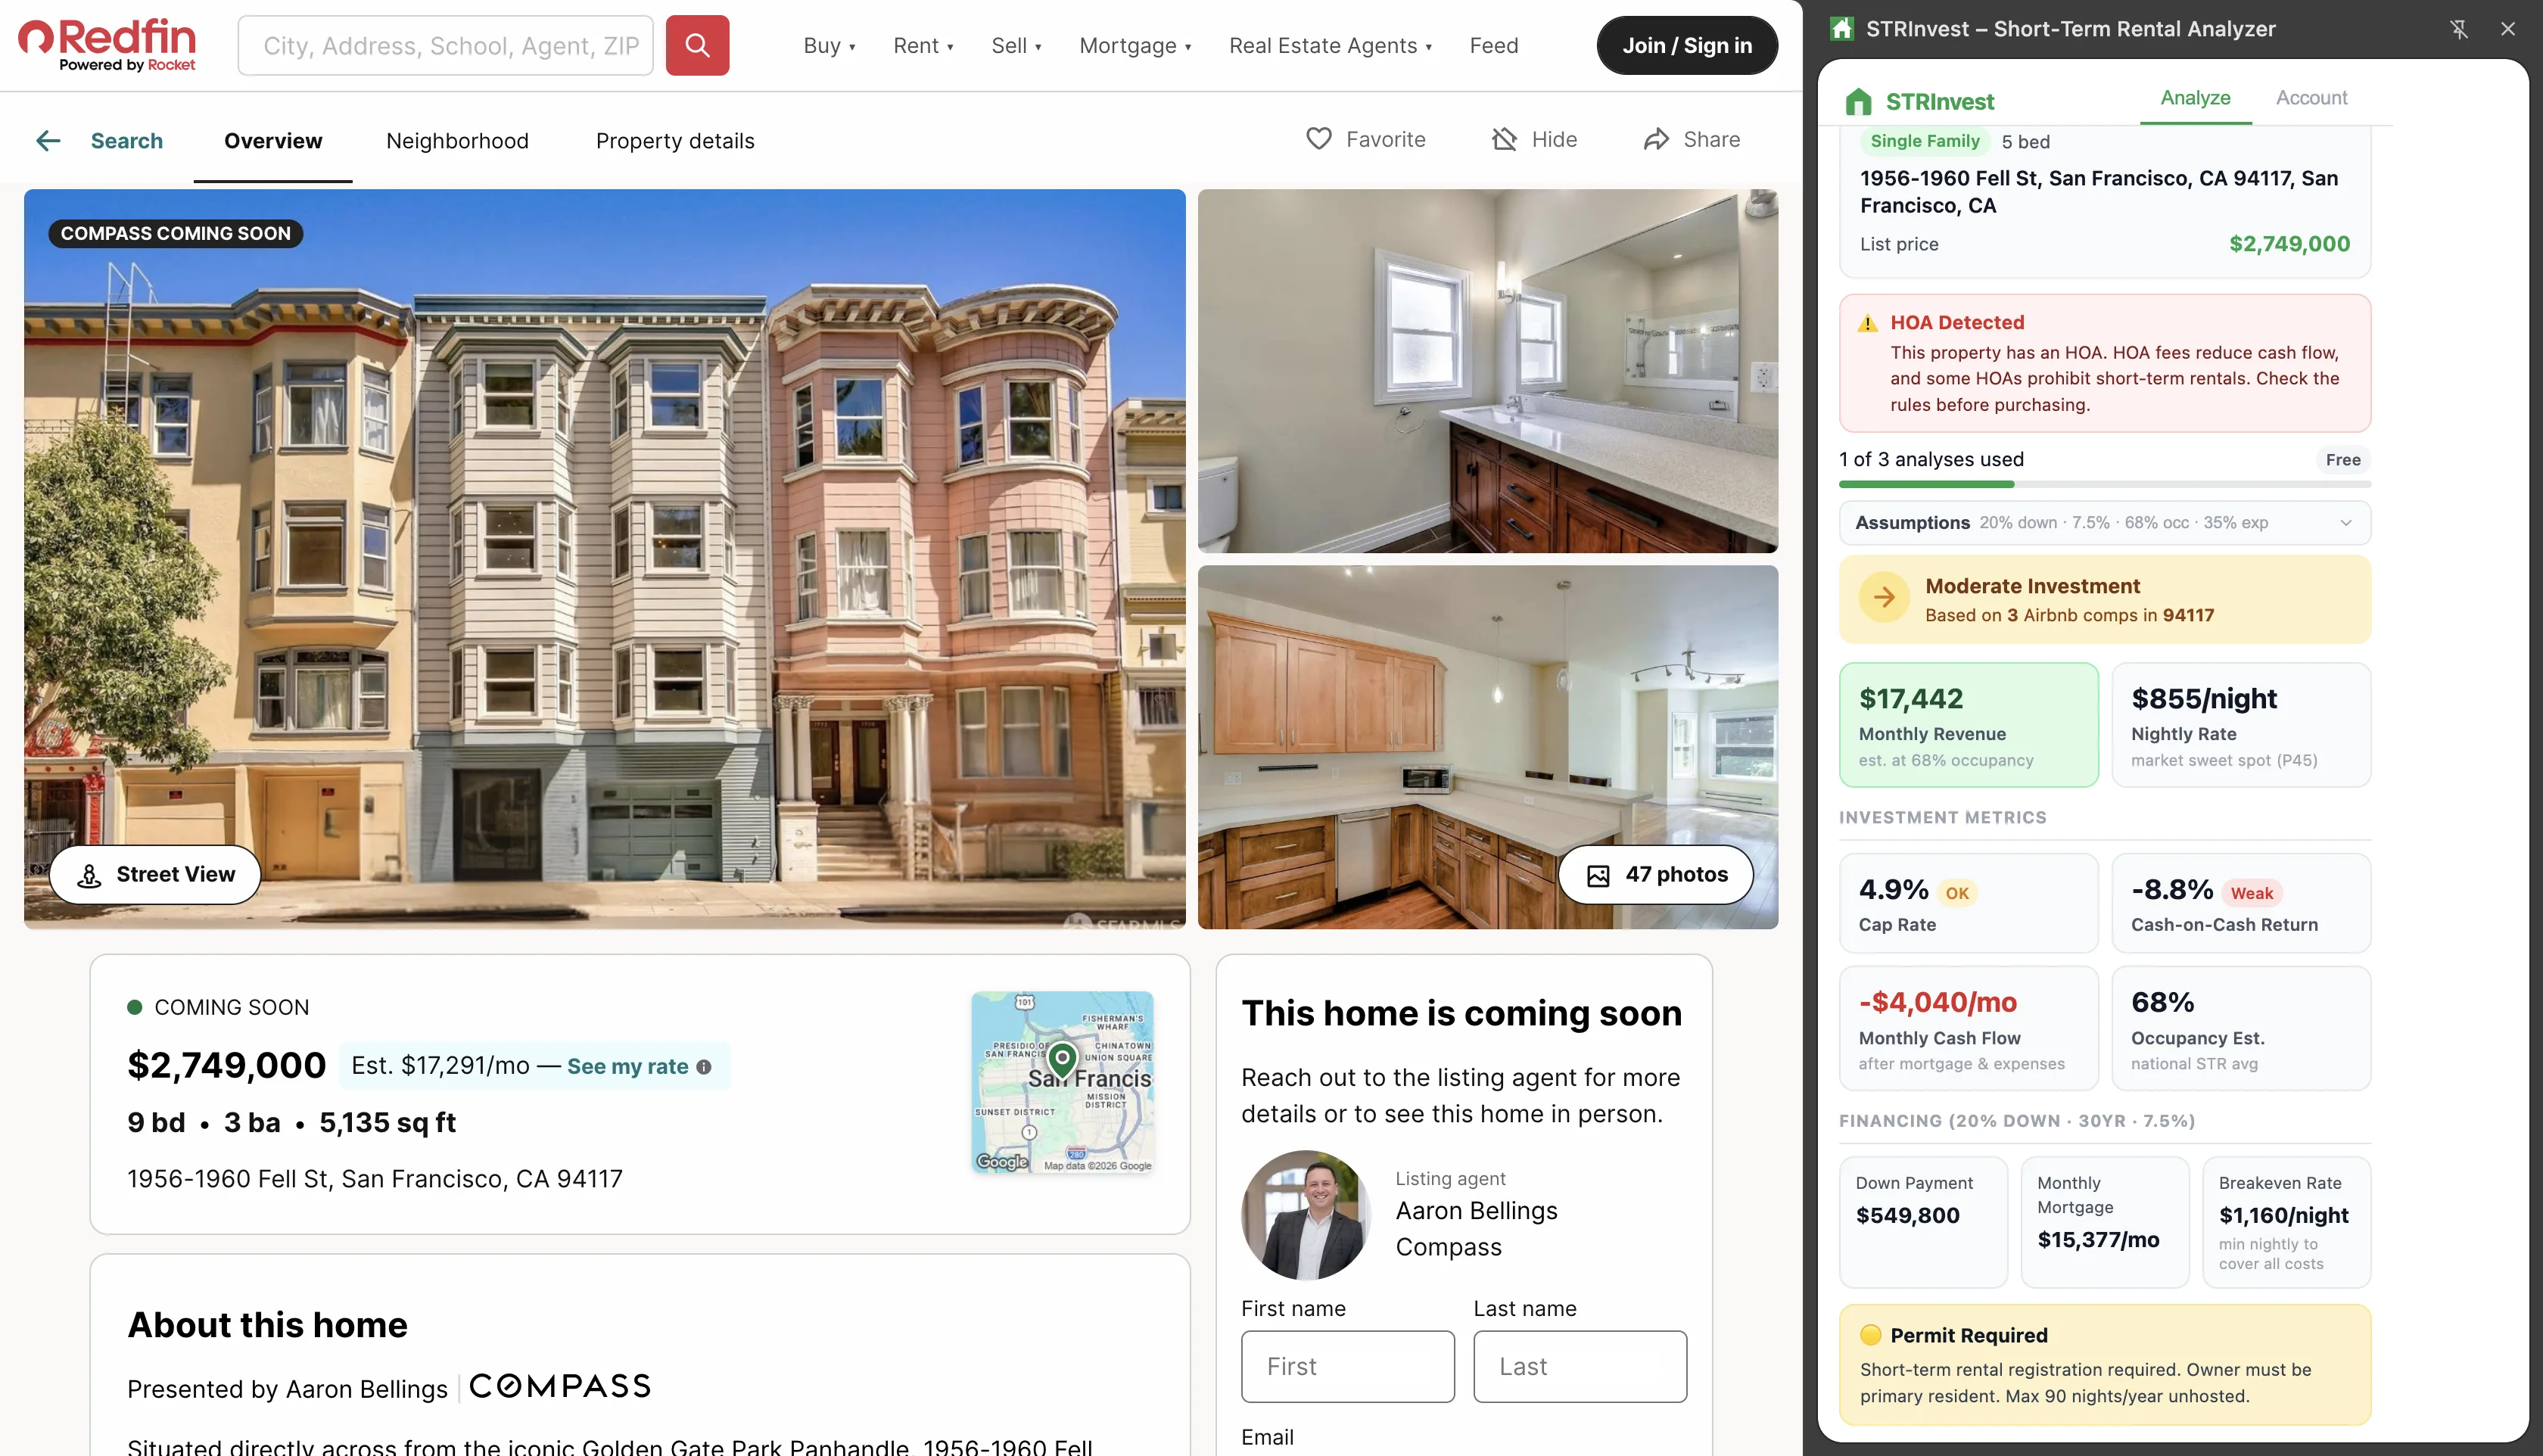
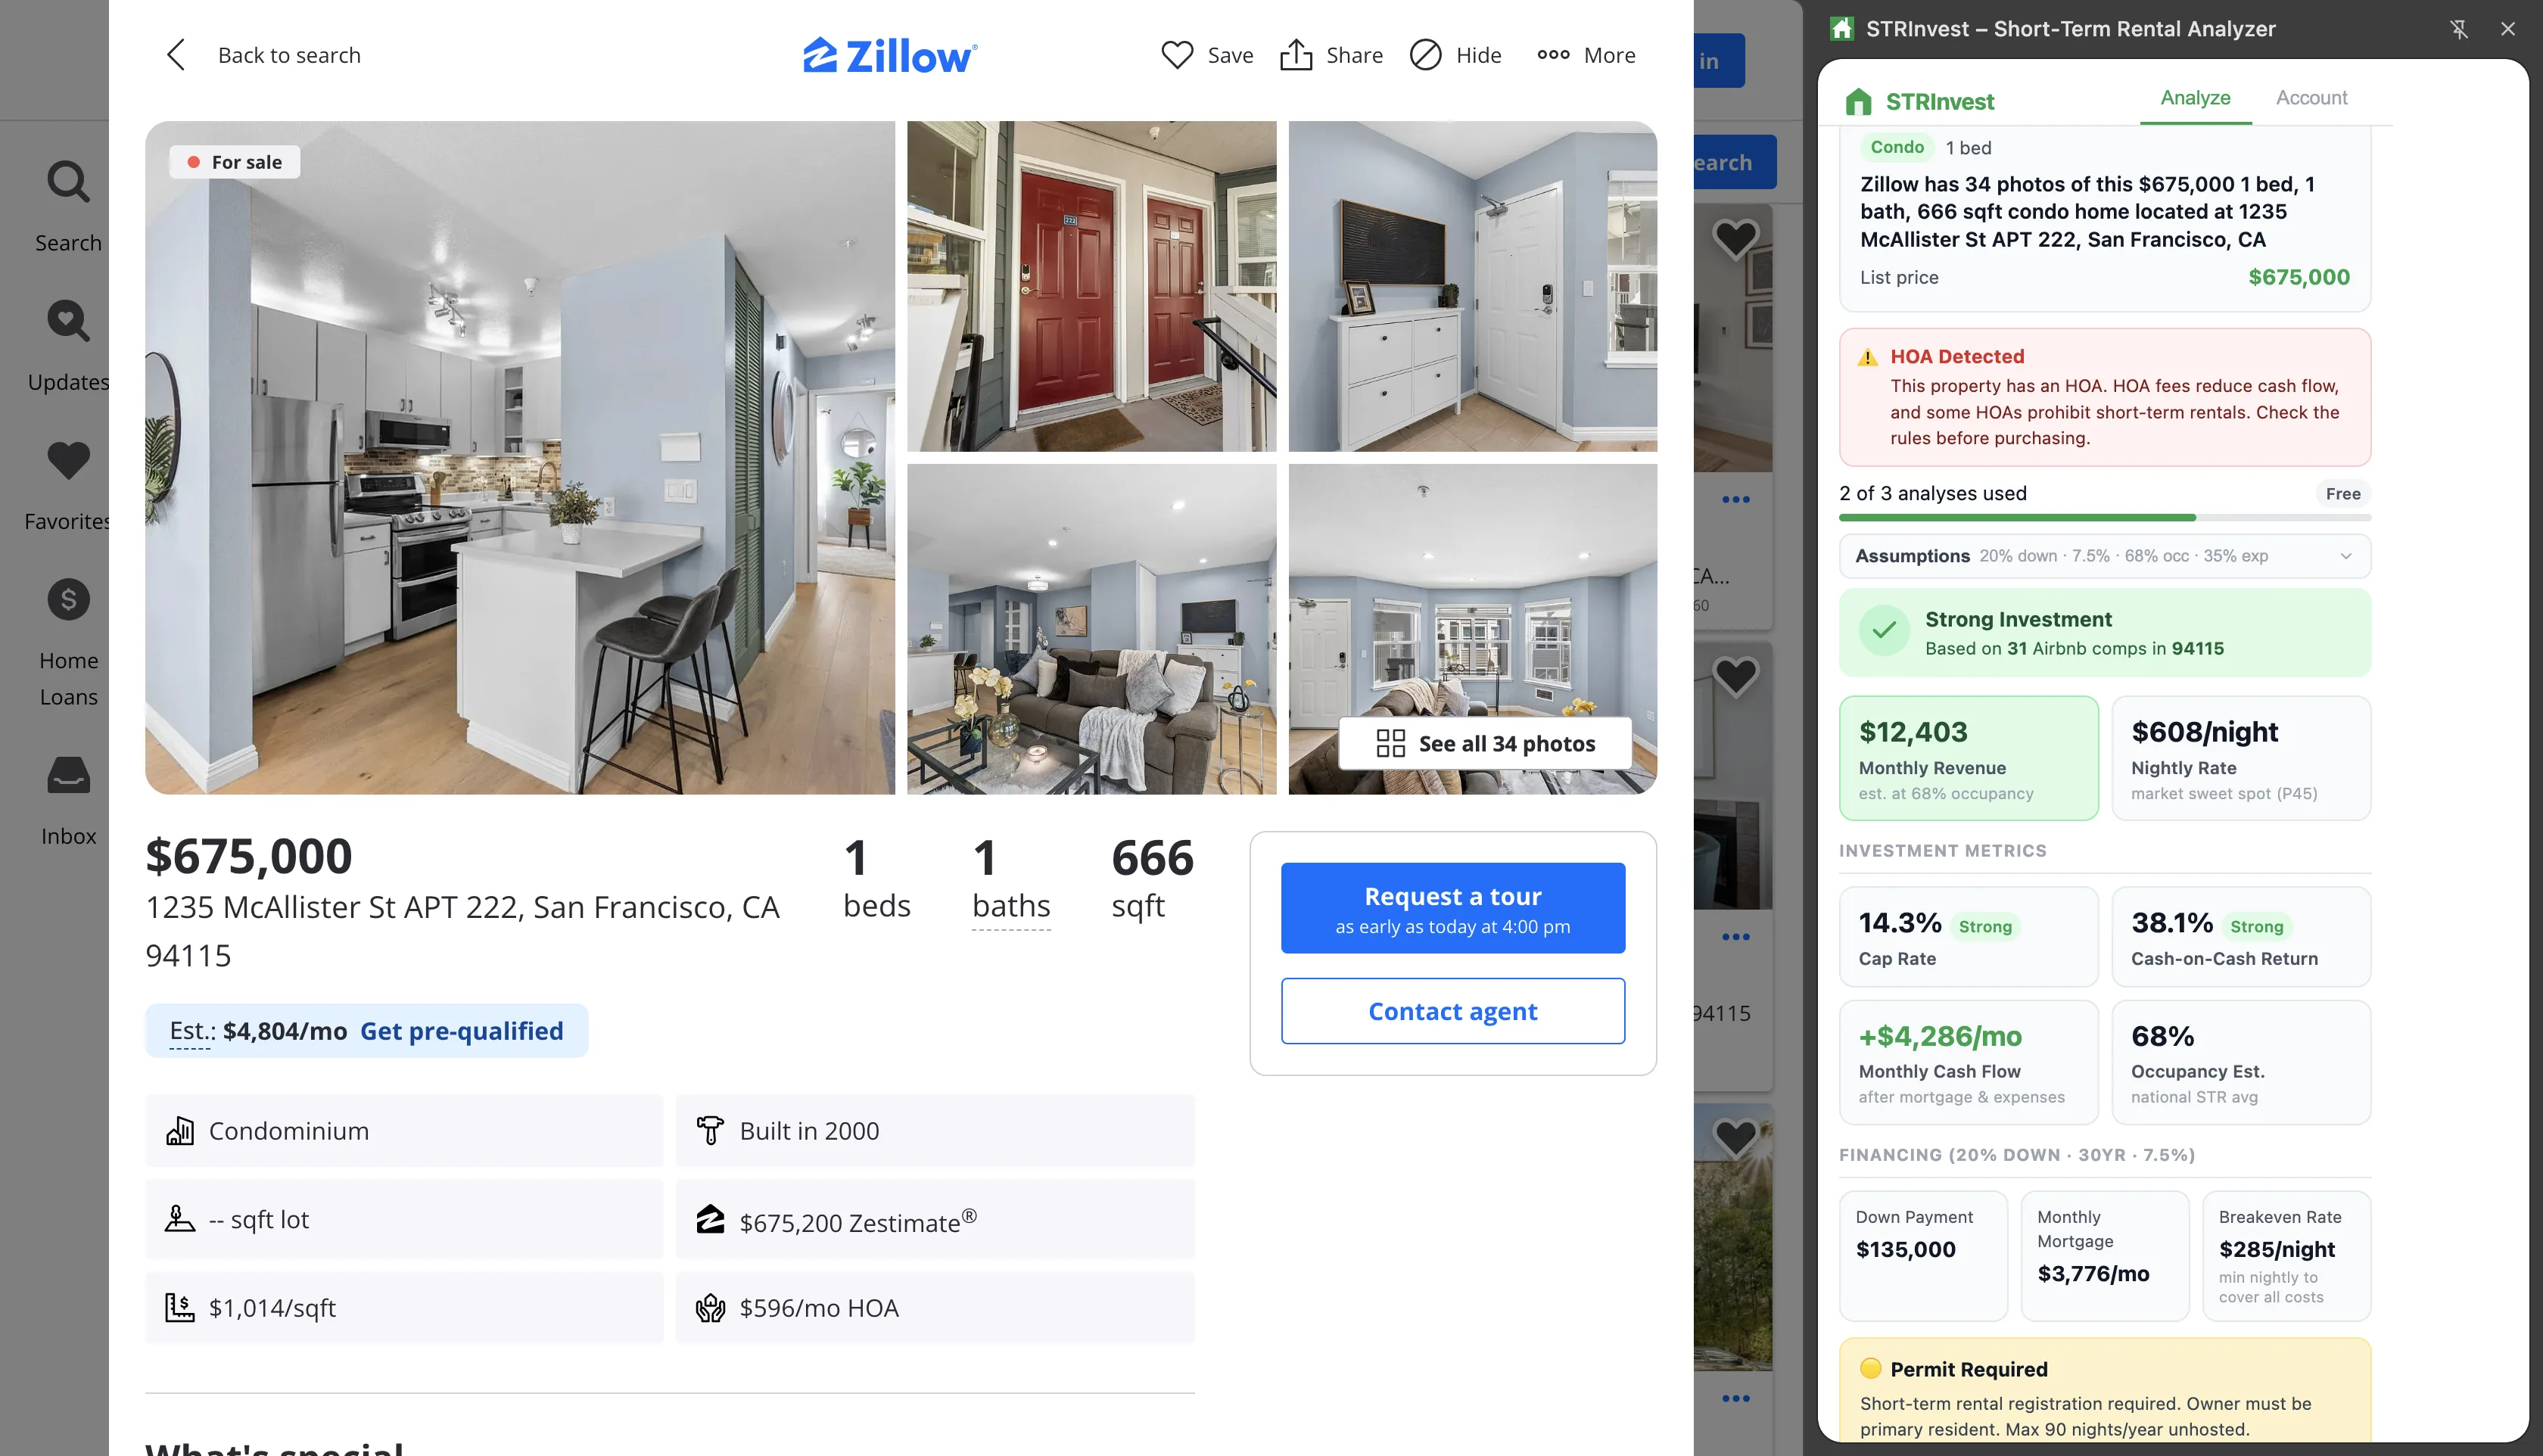
Real analysis — 2BR condo in San Francisco, CA (zip 94115)

📍 2075 Sutter St APT 501, San Francisco, CA · 2 bed · $1,249,000
$12,832
Monthly Revenue · est. 68% occ
$629/night
Nightly Rate · market P45
Cap Rate8.0%
CoC Return6.5%
Cash Flow+$1,354/mo
Breakeven$527/night
Based on22 Airbnb comps in 94115
🟡 Permit Required — STR registration required. Owner must be primary resident. Max 90 nights/year unhosted.
Pricing
Simple, honest pricing
Free
$0 / month
  • 3 analyses per month
  • Full investment scorecard
  • Airbnb comparable listings
  • STR regulation lookup
  • No credit card required
Analyze a property — Free
FAQ
Common questions
STRInvest works with Zillow (zillow.com/homedetails/...), Redfin, and Realtor.com listings. Paste any listing link into the web app to analyze it — no install needed — or add the optional free Chrome extension to analyze while you browse.
STRInvest pulls live pricing from real Airbnb search results — same zip code, same bedroom count, for 4 upcoming weekends. It's actual market data, not estimates or historical averages.
The metrics use the market nightly rate (P45 of comparable listings), 68% occupancy (national STR average per AirDNA), 35% expense ratio, and standard 30-year mortgage math. You can adjust all assumptions yourself. They're a solid starting point — always verify with your own numbers before purchasing.
Regulation data covers 100+ major US markets and is updated quarterly. STR laws change frequently — always verify current local rules with your city or a local attorney before purchasing.
All property analysis runs locally in your browser. The only data we store is your account email and usage count. No property data, search history, or financial information is ever sent to our servers.

STRInvest Guides & Resources

Step-by-step guides for getting the most out of STRInvest.

How to Analyze an STR Investment on Zillow
Use STRInvest to pull revenue estimates, cap rate, and cash-on-cash return directly on Zillow listings.
Cap Rate vs Cash-on-Cash Return for STR Investors
Which metric matters more when evaluating a short-term rental investment?
Best Short-Term Rental Markets in 2026
Where to invest in STR properties based on revenue potential, regulations, and competition.
How to Check Airbnb Regulations Before Buying a Property
How to verify STR permit requirements and zoning rules before you commit to a purchase.
STR vs LTR: Which Rental Strategy Wins in 2026?
A data-driven comparison of short-term and long-term rental returns by market.
View all STRInvest guides →

Start analyzing deals today

Free to start. 3 analyses per month, no credit card, nothing to install.

Analyze a property — Free