The STR vs. LTR question is one that most real estate investors approach backwards — they pick a strategy based on what they've heard works, then go looking for a property that fits. The better approach is the opposite: find a property with strong fundamentals, then model both strategies and let the numbers tell you which one makes sense for that specific asset in that specific location.
This guide gives you the complete framework for making that comparison — including the dimensions that most "STR vs. LTR" comparisons skip, like tax treatment, financing differences, and what the right answer looks like for different property types.
The Core Difference Between STR and LTR
The fundamental difference is not revenue — it's how revenue is generated and what that implies for operations, risk, and the type of investor who can successfully execute each strategy.
Short-term rental is a hospitality business with a real estate asset at its core. Revenue is priced per night (ADR × occupancy nights booked), which means income varies daily based on demand, pricing, and listing quality. The operator — or their property manager — is running a continuous guest acquisition, service, and logistics operation. A poorly managed STR underperforms its market by 20–40%; a well-managed one outperforms by the same margin.
Long-term rental is a leasing business with a real estate asset at its core. Revenue is a fixed monthly amount agreed at lease signing. Income is predictable, but the rate is set at lease execution and changes only at renewal. The operator's primary job is tenant selection and property maintenance — not daily guest management. A well-selected tenant in a well-maintained property requires minimal active management.
| Dimension | Short-Term Rental | Long-Term Rental |
|---|---|---|
| Revenue model | ADR × occupancy nights | Fixed monthly rent |
| Income predictability | Variable (seasonal, demand-driven) | High (contractual) |
| Gross revenue vs. LTR | 1.5–2.5× higher (tourism markets) | Baseline |
| Operating expense ratio | 35–50% of gross (excl. mortgage) | 15–25% of gross (excl. mortgage) |
| Management intensity | High (5–15 hrs/week self-managed) | Low (1–3 hrs/month) |
| Regulatory risk | High (permit-dependent) | Low (landlord-tenant law) |
| Tax advantage potential | High (material participation deduction) | Standard passive loss rules |
| Property type fit | Tourism-adjacent, destination markets | Residential, non-tourism markets |
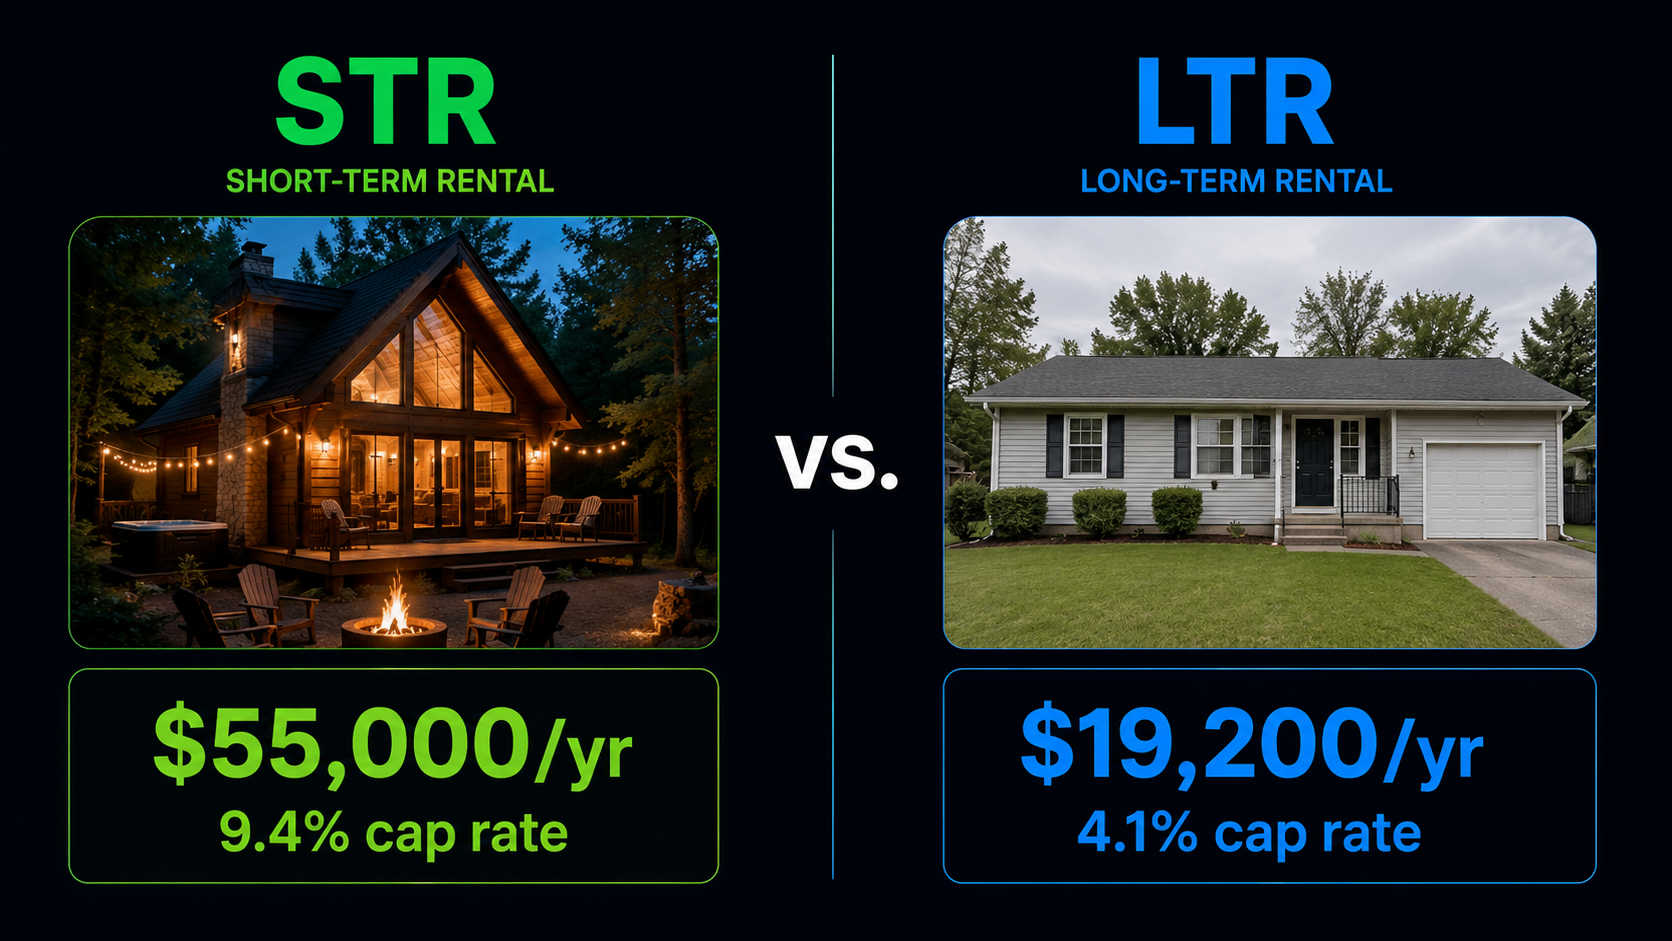
Return Comparison: Where STR Wins
In tourism-adjacent markets, the revenue advantage of STR is decisive. Let's use a real example: a $350,000 3-bedroom cabin in the Smoky Mountains of Tennessee.
STR operating costs (cleaning, utilities, supplies, PM): $22,000/year (40%)
STR NOI: $33,000/year
STR cap rate: $33,000 ÷ $350,000 = 9.4%
LTR monthly rent (same property): $1,600/month
LTR gross annual revenue: $19,200/year
LTR operating costs (PM 10%, maintenance, vacancy): $4,800/year (25%)
LTR NOI: $14,400/year
LTR cap rate: $14,400 ÷ $350,000 = 4.1%
The STR cap rate is more than twice the LTR cap rate on the same property. At 20% down ($70,000) and 7.5% rate, the STR produces a cash-on-cash return of approximately 11–13%, while the LTR produces approximately 3–4%. In most resort and destination markets, this gap is structural — it's driven by the fundamental difference in what the market will pay for a per-night experience vs. a monthly lease.
The STR advantage is also compounding in markets where appreciation tracks the STR premium. Properties in Gatlinburg, Scottsdale, and the Smoky Mountains trade at valuations that already embed STR income assumptions — meaning they appreciate when STR demand grows and when ADRs rise across the market, in addition to the standard housing appreciation baseline.
Return Comparison: Where LTR Wins
STR doesn't win in every market or for every property. Long-term rental is the right strategy when:
The market has no meaningful tourism demand driver
In a suburban residential market without beach access, mountain proximity, urban entertainment, or a strong corporate travel market, STR occupancy will be structurally low regardless of how well the listing is managed. A 55% occupancy rate at $120 ADR produces $24,090 in gross annual revenue — often below what a 12-month lease would generate. In these markets, LTR dominates on both yield and simplicity.
The property is in a regulated market where STR is legally uncertain
If the municipality has pending permit restrictions, a cap on new permits, or a history of ordinance escalation, the STR premium is not bankable. You're underwriting a strategy that might not be executable 12–24 months after closing. LTR carries no such risk — landlord-tenant law is stable and well-established in every jurisdiction.
The investor cannot or will not actively manage the property
A passively managed STR — one where the owner sets it up and leaves it on autopilot — consistently underperforms its market by 15–30%. If you're not willing to manage it actively or pay a professional manager 20–30% of gross revenue to do so, the STR return calculation collapses. LTR performs well with passive management. STR does not.
Work and Management Burden Compared
This is the dimension most return-focused investors underestimate. The CoC return advantage of STR is real — but it comes with a real management burden attached.
Self-managed STR typically requires 5–15 hours per week for a single property. This includes responding to guest inquiries (often within minutes to protect search ranking), coordinating cleaning after every checkout, restocking supplies, handling maintenance issues, managing dynamic pricing, and managing reviews. A well-run STR is closer to a part-time job than a passive investment.
Professional STR management takes the operations off the owner's plate — but at 20–30% of gross revenue. On a $55,000 gross revenue property, that's $11,000–$16,500/year in management fees alone. This significantly narrows the gap between STR and LTR net returns, though a professionally managed STR usually still outperforms LTR in the right markets.
LTR management at the self-managed level requires approximately 1–3 hours per month per property for maintenance coordination and tenant communication. Professional LTR management runs 8–12% of gross rent — $1,500–$2,300/year on a $1,600/month rental. The operational simplicity of LTR is a real advantage that becomes increasingly important as portfolio size grows.
The hybrid approach: Many experienced investors use a co-host for STR guest communication (10–15% of gross) while self-managing the cleaning coordination and supply chain. This captures roughly half the management fee savings of full self-management at about 20–30% of the time commitment — often the best risk-adjusted labor trade-off for a local owner-operator.
Financing Differences: STR vs. LTR Mortgages
Financing is a dimension that meaningfully changes the CoC return calculation and that most STR comparisons gloss over.
For LTR, financing is more straightforward — lenders have established underwriting criteria for long-term rental properties, and 75% of projected rental income is typically countable toward qualifying income. The LTR financing ecosystem is more mature, with cleaner products and fewer lender restrictions on property count.
Regulatory Risk: STR's Biggest Disadvantage
The single most significant structural disadvantage of STR investing is regulatory risk — the possibility that your strategy becomes legally restricted or prohibited after you've acquired the asset. This risk does not exist in LTR investing.
The current regulatory landscape in 2026 has bifurcated. Markets that banned or severely restricted STRs (NYC, San Francisco, Denver, Santa Monica) have largely settled into their restricted state. Markets in the middle — Nashville, Austin, Asheville, Portland — are in various stages of permit tightening that carry ongoing uncertainty. And markets in investor-friendly states like Florida (state preemption law), Tennessee, and Arizona have relatively stable STR regulatory environments.
How to assess regulatory risk before buying: Search "[city name] short-term rental ordinance 2025" and read the actual city council minutes for the past 12 months, not just summary articles. Active ordinance discussions are the leading indicator — a city that has introduced STR restriction legislation twice in two years is signaling direction. Also check HOA CC&Rs for any property in a managed community — HOA restrictions can prohibit STRs regardless of municipal permission.
STRInvest surfaces a regulatory risk tag directly on Zillow and Redfin listings, so you can see the municipality's current STR permit status without leaving the listing page. This is useful for quickly filtering out high-regulatory-risk properties before investing time in deeper due diligence.
Tax Treatment Compared
Tax treatment is where STR has a potential advantage over LTR that most investors don't fully understand — and that depends entirely on how actively you manage the property.
Long-term rental passive loss rules: LTR losses (depreciation + operating costs exceeding rental income) are treated as passive losses, which can only offset other passive income. For most W-2 investors, this means rental losses are "suspended" and carried forward until the property is sold or until passive income materializes. There's a $25,000 active participation exception for LTR investors who actively participate (not just self-manage) and have adjusted gross income below $100,000 — but this phases out entirely at $150,000 AGI.
STR material participation: If you spend 500+ hours per year managing your STR and meet the IRS material participation tests, your STR losses are treated as non-passive — meaning they can offset ordinary W-2 income dollar for dollar. For a high-income professional with a $400,000 salary, being able to deduct $30,000 of STR losses (primarily from depreciation) against ordinary income can produce a $12,000–$15,000 annual tax savings that doesn't exist with LTR. This is a meaningful, real advantage — but it requires active management documentation and you should work with a CPA who specializes in STR taxation.
Depreciation: Both STR and LTR benefit from building depreciation (27.5 years for residential). Where STR has an accelerated advantage is in personal property — furniture, appliances, electronics, and other short-lived assets that make up 20–35% of total property value in a furnished STR. These depreciate over 5–7 years rather than 27.5, producing front-loaded depreciation deductions in years 1–5 that can be significant for cost-segregation study participants.
Which Strategy Fits Which Property Type
The property type and location determine which strategy is optimal — not the investor's preference.
Cabins, lake houses, beach properties → STR
These property types exist in destination markets with specific tourism demand drivers. Long-term tenants for a lake cabin typically rent at 40–60% of what STR generates, and in most cases the infrastructure (furnished, amenity-rich, vacation-oriented) makes LTR operations awkward anyway. STR is almost always the correct strategy for destination-type properties in functioning tourism markets.
Urban condos in regulated cities → LTR or mid-term
NYC, San Francisco, Chicago, Denver, and many other major urban markets have either banned non-owner STRs or made operating them effectively impractical. Urban condos in these markets are LTR or mid-term rental assets. Even in cities without explicit bans, HOA restrictions in high-rise and managed condo buildings frequently prohibit STRs regardless of what the city allows.
Suburban single-family in non-tourism markets → LTR default
A 3-bedroom house in a suburban residential neighborhood without proximity to a tourism driver produces below-market STR occupancy regardless of how well it's managed. LTR is the default strategy. Exception: markets with strong corporate relocation demand (large employers within 15 miles, military bases, hospitals) can produce strong mid-term rental income for furnished suburban homes.
Duplex/triplex → mix strategically
Multi-unit properties in appropriate markets offer a risk management strategy that single-family properties don't: running one unit as STR and the others as LTR. The LTR units cover fixed costs (mortgage, insurance, taxes) regardless of STR occupancy, providing a cash-flow floor that protects against seasonal STR volatility. The STR unit captures premium revenue during peak demand. This is often the highest-risk-adjusted return structure available in a well-located multi-unit asset.
How to Run Both Analyses Before You Buy
Run the STR side of the analysis in 60 seconds
STRInvest overlays Airbnb revenue estimates, cap rate, and cash-on-cash return on every Zillow and Redfin listing — so you can compare STR vs. LTR without building a spreadsheet from scratch.
Add to Chrome — Free →3 free analyses/month · Pro at $9.99/mo