Most "best STR markets" lists rank cities by gross revenue or ADR — numbers that tell you how much the top performers earn, not whether a new acquisition there would actually cash flow for you. A market with a $90,000 median annual gross revenue and $900,000 median property prices is a worse investment than one where $50,000 gross revenue is achievable on a $300,000 acquisition.
This guide ranks markets the way investors should: by cash-on-cash return on a realistic acquisition, adjusted for occupancy trends, entry price, and regulatory risk. We've also included the markets where those metrics are deteriorating — so you know where not to deploy capital in 2026.
How We Ranked the Markets
Each market was evaluated on four criteria:
These four metrics together filter out markets that look exciting in headlines but underperform in spreadsheets — and surface markets that consistently produce real investor returns even in 2026's higher-rate environment.
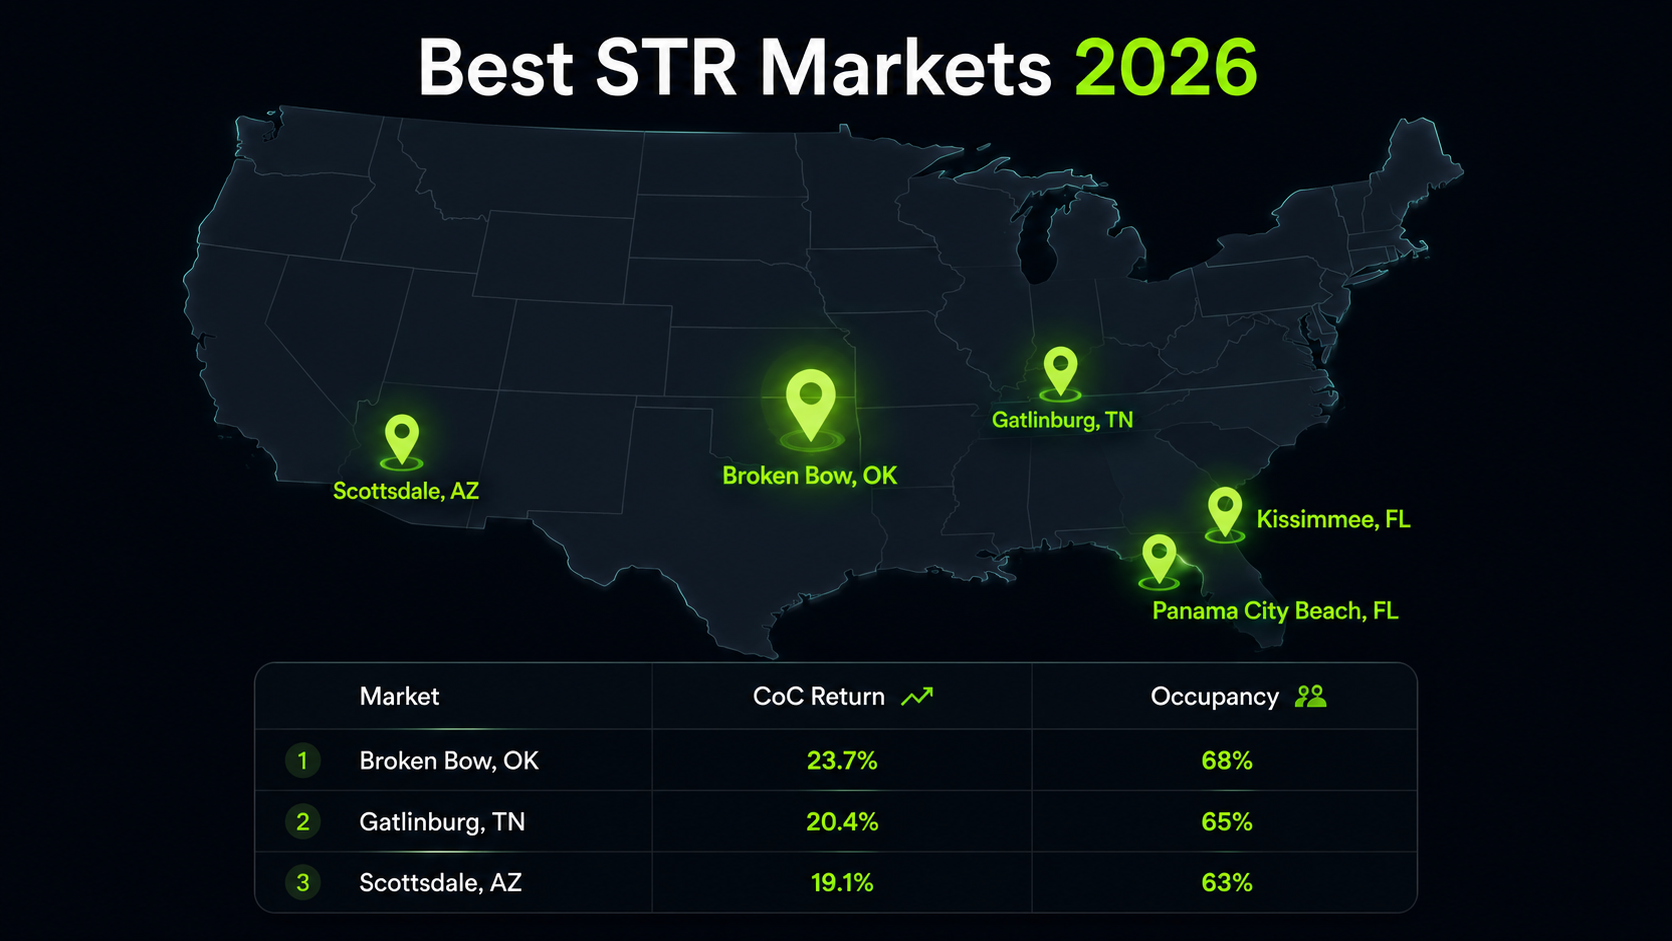
Top 5 High-Yield Markets
These markets combine below-average property prices with above-average STR revenue, producing the highest cash-on-cash returns available to investors entering today.
Gatlinburg / Pigeon Forge, TN
The Smoky Mountains remain the single most reliable high-yield STR corridor in the country. Cabin demand is year-round, driven by a combination of romantic getaways, family vacations, and fall foliage tourism. The key advantage is entry price: quality 2–3BR cabins still trade at $280,000–$420,000, while annual gross revenue of $45,000–$70,000 is achievable with a well-positioned listing. Tennessee's zero income tax on STR revenue and the market's mature tourism infrastructure (consistent year-round demand, established PM ecosystem, deep guest review base) make this the benchmark against which every other market should be measured. Regulatory environment remains investor-friendly at the county level, though individual developments may have HOA restrictions.
Scottsdale, AZ
Scottsdale's STR market benefits from a demand driver that most resort markets don't have: year-round corporate and conference demand that smooths seasonal volatility. Spring training (February–March), corporate events, bachelorette tourism, and winter sun seekers produce 72%+ average occupancy. The trade-off is entry price — median STR property prices are $550,000–$850,000, which compresses CoC returns relative to Tennessee cabin markets. The 2–3BR luxury condo segment ($450,000–$650,000) produces the best yield per dollar invested. Regulation has been mostly stable, though Scottsdale has periodically revisited its STR ordinance. Current status: permits required, but available and enforceable.
Panama City Beach, FL
Panama City Beach offers beach-adjacency STR returns at significantly lower entry prices than comparable Florida coastal markets. Median 2BR condo prices of $280,000–$380,000 paired with annual gross revenues of $40,000–$58,000 (driven by spring break and summer peak demand) produce strong yield metrics. The market is evolving — corporate and convention demand is growing year-round, reducing the peak-heavy seasonality that previously made off-months cash-flow negative. Florida's state preemption law prevents most municipal STR bans, providing structural regulatory protection that sets it apart from states where local bans are more legally viable.
Kissimmee, FL
The Disney/Orlando demand buffer makes Kissimmee one of the most defensible STR investments in the country. Theme park visitation is the most demand-stable tourism driver that exists — families don't cancel Disney vacations when the economy softens. Entry prices of $250,000–$380,000 for 3–4BR vacation homes within 10 miles of Disney produce annual gross revenues of $38,000–$55,000. The saturated vacation rental market in this corridor means listing quality and pricing strategy matter enormously — average operators underperform while active, well-managed listings consistently hit 68–75% occupancy. STR-friendly zoning in unincorporated Osceola County is well established.
Broken Bow, OK
Broken Bow is the highest-yield market in this ranking for investors who accept an emerging-market risk profile. Luxury cabin demand in the Ouachita Mountains has grown rapidly over the past four years, driven by proximity to Dallas/Fort Worth (3.5-hour drive) and an Instagram-driven cultural moment around secluded cabin getaways. Sub-$300,000 cabin acquisitions routinely produce $40,000–$55,000 in annual gross revenue when managed actively. The regulatory environment is extremely investor-friendly — McCurtain County has no STR permit requirement. The risk is the typical emerging market risk: demand driven by a trend rather than permanent infrastructure, and a market that could see supply growth that compresses yields if the trend continues to attract investors.
Top 5 Mid-Tier Markets
These markets balance demand stability with more moderate entry prices and CoC return targets. They're appropriate for investors who prioritize predictability over maximum yield.
Nashville, TN
Nashville's bachelorette and entertainment tourism generates high ADRs ($195–$280/night for well-positioned downtown and Midtown units) but rising property prices have compressed yields meaningfully since 2021. The city's permit system is now more strictly enforced, and non-owner-occupied STR permits in certain zones are effectively capped. Investors who bought in 2019–2021 hold strong cash-flowing assets. Buyers entering today should model conservatively — the 7–10% CoC return range is achievable but not guaranteed, and permit availability must be verified before closing.
Myrtle Beach, SC
Myrtle Beach's combination of affordable oceanfront condos ($180,000–$320,000), 60+ miles of beach, and growing year-round corporate golf tourism produce solid mid-tier returns. Seasonality is pronounced — July/August weekends produce 2× January rates — but a monthly income model still pencils well when summer peak revenue is sufficient to absorb weaker off-months. The regulatory environment is investor-friendly at the state level, and the HOA landscape is well-mapped — most large condo complexes in Myrtle Beach have established STR-permitted track records.
Asheville, NC
Asheville is a case study in how supply restrictions protect existing operators. The city now operates a lottery-based STR permit system — new permits are effectively rationed, which caps supply growth and protects the revenue of licensed operators. Investors who already hold or can acquire a permitted property have a structural moat that most markets lack. Entry prices of $380,000–$550,000 for well-positioned properties are offset by ADRs of $200–$290/night driven by the city's arts, culinary, and outdoor recreation appeal. For anyone buying a property that doesn't already have an STR permit, verify permit availability before making an offer.
Gulf Shores, AL
Gulf Shores offers strong beach-market fundamentals at prices that remain below comparable Florida Gulf Coast markets. The demand profile is primarily summer family vacations with a growing spring shoulder season. Entry prices of $280,000–$450,000 for 2–4BR units within walking distance of the beach produce annual gross revenues of $38,000–$60,000 for well-managed listings. Alabama's regulatory environment is currently STR-investor friendly, and the Gulf Shores market has a mature vacation rental infrastructure with established local PM firms and deep guest review ecosystems on Vrbo and Airbnb.
Joshua Tree, CA
Joshua Tree punches above its weight because design-forward cabin listings command premium ADRs ($250–$400/night) while acquisition costs remain relatively modest for California ($350,000–$550,000 for small desert homes). The market is driven by L.A./O.C. weekend escapes and has developed a strong Instagram identity that consistently produces organic listing discovery. The key risk: Joshua Tree is supply-constrained by both land availability and water access — which protects existing operators but limits the universe of acquirable properties. San Bernardino County has an STR permit system; verify permit status before closing.
Top 5 Emerging Markets
These markets offer higher yield potential and appreciation upside but carry the typical emerging-market risks: less established demand drivers, thinner comp data, and more uncertainty in forward revenue projections.
| Market | Median Entry Price | Est. Annual Gross | Avg Occupancy | Est. CoC (20% dn) | Reg Risk |
|---|---|---|---|---|---|
| Chattanooga, TN | $280K–$380K | $32K–$48K | 62% | 8–13% | Low |
| Taos, NM | $350K–$550K | $38K–$58K | 60% | 7–11% | Low |
| Bozeman, MT | $420K–$650K | $42K–$62K | 63% | 7–10% | Low |
| Tulsa, OK | $180K–$280K | $22K–$36K | 58% | 8–13% | Low |
| Lake Havasu City, AZ | $280K–$420K | $32K–$48K | 61% | 8–12% | Low |
Chattanooga, TN benefits from Tennessee's zero income tax and the same outdoor recreation infrastructure that makes the Smoky Mountains attractive — hiking, climbing, whitewater — but at lower entry prices and without the cabin-market saturation. Bozeman, MT is a Yellowstone gateway market with year-round demand (ski season + summer national park access) that is still relatively underdeveloped as an STR market compared to its demand fundamentals. Lake Havasu City, AZ produces strong spring break and boating season revenue on sub-$400K acquisitions.
Markets to Avoid in 2026
Not every market with a famous tourism brand translates to a sound STR investment. These markets should be avoided for different reasons.
New York City, San Francisco, Denver: Near-total permit bans or effectively impossible to legally operate as an STR investor. NYC's Local Law 18 requires owner-presence for bookings under 30 days and caps guests at 2 — effectively ending traditional short-term rental in the five boroughs for non-owner-operators. These markets are off the table for STR investors regardless of the demand metrics.
Austin, TX: Supply growth that outpaced demand through 2022–2024 has produced flat-to-declining RevPAR in most sub-markets. Active Airbnb listing counts in Austin grew 40%+ in two years while visitation growth was in the single digits. ADR compression and below-market occupancy rates make it difficult to achieve 8%+ CoC returns at current property prices without exceptional listing management.
Miami Beach, FL: The city's regulation escalation — which moved from permit requirements to effectively banning non-owner STRs in many zones — combined with property prices that have already priced in the STR premium, means most new acquisitions can't produce competitive returns. Existing permitted operators are protected; new entrants face both regulatory and financial headwinds.
The leading indicator to watch in any market: if you see active Airbnb listing counts growing more than 15% year-over-year while RevPAR is flat or declining, the market is absorbing supply faster than demand is growing. That's a structural warning sign that typically precedes several years of yield compression.
How to Evaluate Any Market Yourself
The three-step process that works for any market, including ones not on this list:
CoC return ≥ 8% at 20% down (cash flow after mortgage ÷ cash invested)
Stress test: still cash flows positive at 55% annual occupancy
If the deal doesn't clear all three at conservative inputs, pass.
The Market Metrics That Actually Matter
RevPAR (Revenue Per Available Room-Night) is the single best market health metric. It combines ADR and occupancy into one number: RevPAR = ADR × occupancy rate. A market with a $180 ADR and 70% occupancy has a RevPAR of $126. A market with a $220 ADR and 55% occupancy has a RevPAR of $121 — the higher headline rate actually produces less revenue. When comparing markets, always compare RevPAR, not ADR alone.
Regulatory moat is underappreciated. Markets where the permit supply is capped — Asheville's lottery system, Santa Barbara's near-permit-freeze — protect existing operators from supply growth. A property in a capped-supply STR market is more valuable than its current yield suggests, because future competition is structurally limited.
Seasonality spread measures how much your peak revenue must subsidize your off-peak months. A market with a 3:1 peak-to-off season revenue ratio (earning $6,000 in July and $2,000 in January) requires enough peak revenue to cover 12 months of fixed costs including mortgage payments. Model every month individually before underwriting — annual averages hide the cash-flow gaps that break deals in the slow months.
How STRInvest Pulls Revenue Data for Any ZIP
Rather than relying on market-level reports, STRInvest pulls revenue estimates at the individual listing level — which is the only level where investment decisions are actually made.
When you open a Zillow or Redfin listing, STRInvest overlays:
- Estimated annual Airbnb revenue — calculated from comparable active listings in the same ZIP, adjusted for the property's bedroom count and the market's trailing occupancy rate
- Cap rate — estimated NOI divided by the listing's price, using standard operating cost assumptions for the market
- Cash-on-cash return — modeled using your financing inputs (down payment %, interest rate, term)
- STR regulation tag — flags the municipality's current STR permit status so you can see regulatory risk without leaving the listing page
The full manual version of this analysis — pulling comps, calculating ADR, estimating occupancy, building the NOI model — takes 3–6 hours per property. STRInvest surfaces the same core numbers in under 60 seconds, which means you can quickly filter a market's listings to identify the ones that clear your return thresholds before spending hours on deep due diligence.
Analyze any STR market in 60 seconds
STRInvest shows you Airbnb revenue estimates, cap rate, and cash-on-cash return on every Zillow and Redfin listing. No spreadsheets. No manual comp research.
Add to Chrome — Free →3 free analyses/month · Pro at $9.99/mo