Every STR investment decision ultimately comes down to a single number: how much revenue will this property generate? Get that number right and the rest of the underwriting — cap rate, cash-on-cash return, break-even occupancy — falls into place. Get it wrong by 20%, and a deal that looked like a 10% CoC return on paper turns into a 6% return in practice. Get it wrong by 40% and you've bought a property that will lose money every month.
The problem is that the most commonly used revenue estimation methods are systematically biased toward optimism. This guide shows you why, and gives you the methodology that produces realistic forward-looking projections.
Why Most Revenue Estimates Are Wrong
The four most common estimation errors, in order of how frequently they break deals:
Airbnb's "Estimated Earnings" tool is systematically optimistic
Airbnb's built-in earnings calculator is designed to encourage hosting sign-ups, not to provide accurate investment underwriting. Multiple independent analyses have documented that it overstates expected revenue by 20–40% in most markets, particularly for properties that don't yet have reviews and search visibility. Never use Airbnb's own tool as your primary revenue estimate for an investment decision.
Owner-provided revenue histories don't represent a new operator's baseline
Seller revenue histories reflect years of accumulated listing optimization, review building, and operational refinement. A host with a 4.9 rating, 300+ reviews, and Superhost status will out-earn a new listing in the same property by 15–30% for the first 6–12 months. Seller histories also sometimes include peak periods that aren't representative of forward market conditions, and occasionally mix gross platform revenue with net owner payouts.
National and city averages mask ZIP-level variance
A $250/night median ADR "in Scottsdale" tells you nothing useful about a specific property if it's located in a peripheral sub-market where comparable active listings price at $160–$190/night. Revenue is hyper-local. The relevant unit of analysis is a 2–3 mile radius with comparable product — not the MSA, not the metro, and certainly not the state or national average.
Anchoring to the best comp rather than the median
When browsing comparable listings, investors naturally focus on the high-performers — the 4.9-rated, beautifully-photographed, heavily-reviewed listings that dominate search results. These are not representative of what a new listing will earn. A new listing in the same market with zero reviews will rank lower, convert worse, and command a lower rate. You should be anchoring to the median or slightly below median comp, not the top performers.
The Three Inputs That Determine STR Revenue
Every STR revenue projection is built from three numbers:
Where:
ADR = Average Daily Rate (what you charge per booked night)
Occupancy Rate = % of available nights that are booked (annual average)
Example: ADR $180 × (365 × 0.68) = $180 × 248 nights = $44,640/year
This formula looks simple, but the compounding error sensitivity is what makes revenue estimation risky. If you overestimate ADR by 10% ($180 → $198) and overestimate occupancy by 10% (68% → 75%), your revenue estimate is $198 × 274 nights = $54,252 — a 21% overestimate of the $44,640 correct figure. In other words, two individually "minor" 10% errors compound to a 21% overestimate that can turn a solid deal into a marginal one.
Step 1 — Find True Comparable Listings
A "true comp" for STR revenue estimation must meet four criteria:
- Same market, within 3 miles: Tourism demand is hyper-local. A beachfront property and an inland property 2 miles away can have 40% ADR differences. Stay within 2–3 miles of the subject property.
- Same bedroom count: Revenue scales roughly linearly with bedroom count up to 3BR, then less linearly above that. A 2BR and a 4BR are not comps for each other.
- Similar amenity tier: A listing with a private pool commands a 20–35% ADR premium. A cabin with a hot tub earns more than one without. Strip out comps with amenity sets significantly above or below what you're buying.
- Similar listing maturity: Filter for listings with 20–100 reviews — these represent properties that have cleared the initial ramp-up period but aren't yet deeply embedded in the algorithm. Listings with 200+ reviews are better established than a new acquisition will be.
The new listing discount: Plan for 15–25% below-median occupancy for the first 3–6 months of operation as you accumulate reviews. Even in a strong market, a listing with zero reviews won't convert at the same rate as established comps. Build this into your Year 1 model — project the first 6 months at 20% below comp-baseline occupancy, then ramp to full market rate in months 7–12.
Target 8–12 true comps. Pull them from Airbnb search using the market location, bedroom count, and amenity filters. Keep a simple spreadsheet with the listing name, displayed rate (next 60 days average), review count, and rough amenity set for each comp.
Step 2 — Estimate Average Daily Rate (ADR)
ADR estimation from comp data requires some nuance — displayed rates are not the same as booked rates, and seasonal variance is significant in most markets.
Pulling rates from active listings: For each of your 8–12 comps, note the displayed rate for the next 60 days of available dates. Exclude special event pricing spikes and outlier weeks. Calculate the median (not average) across your comp set. Remove the top 10% and bottom 10% outliers before calculating — you want the market median, not a number skewed by one exceptional listing.
Example (beach market with 3 peak, 4 shoulder, 5 off months):
($280 × 3 + $190 × 4 + $130 × 5) ÷ 12
= ($840 + $760 + $650) ÷ 12
= $2,250 ÷ 12 = $187.50 blended annual ADR
Most investors make the mistake of using the rate they see when they research a market (which is often peak or near-peak) as their annual ADR. In a market with meaningful seasonality, that will overstate your annual revenue by 20–40%. Build a 12-month ADR model, not a single average.
Step 3 — Estimate Annual Occupancy Rate
Occupancy estimation is the most hands-on part of the manual process — and the most commonly skipped step by investors who substitute market averages.
Calendar counting method: Open the Airbnb calendar for 5–8 of your comps and count the number of booked nights in the trailing 30 days. Booked nights appear as grey/crossed-out dates; available dates appear as open. Do this mid-week to avoid the weekend pricing skew. Calculate the occupancy rate for each comp: (booked nights ÷ 30) × 100.
Watch for intentional blocking: Some hosts block their own calendars for personal use or maintenance periods, which will artificially inflate the apparent vacancy rate. If a listing has a lot of mid-week blocks that don't correspond to obvious maintenance, the owner may be blocking personal-use nights. Discount these comps or exclude them from your occupancy estimate.
Cross-check your manual occupancy estimate against free market-level data from Rabbu.com (which publishes market averages at the city level for free) or AirDNA's free market tier. If your manual estimate is within 5 percentage points of the market average, you have a reliable baseline. If they diverge significantly, investigate why — you may have inadvertently selected comps that don't represent the broader market.
Step 4 — Apply Seasonal Adjustments
A single blended annual revenue figure hides the month-by-month cash flow reality that determines whether a property is actually viable. You need a 12-month model.
| Month | Season | ADR Multiplier | Occupancy Rate | Monthly Revenue |
|---|---|---|---|---|
| January | Off | 0.65× | 52% | ~$1,870 |
| February | Off | 0.70× | 55% | ~$2,060 |
| March | Shoulder | 0.90× | 68% | ~$3,400 |
| April | Shoulder | 0.95× | 70% | ~$3,680 |
| May | Shoulder | 1.00× | 72% | ~$3,940 |
| June | Peak | 1.45× | 85% | ~$6,860 |
| July | Peak | 1.50× | 88% | ~$7,260 |
| August | Peak | 1.40× | 85% | ~$6,580 |
| September | Shoulder | 1.00× | 70% | ~$3,840 |
| October | Shoulder | 1.05× | 72% | ~$4,140 |
| November | Off | 0.72× | 54% | ~$2,140 |
| December | Shoulder | 0.90× | 62% | ~$3,070 |
(Example model for a 2BR beach market property with $175 base ADR. Your numbers will vary by market.)
The monthly model reveals what annual averages hide: in January and February, this property generates $1,870–$2,060/month — potentially less than the monthly mortgage payment. The deal pencils annually, but you need to plan for negative-cash-flow months by holding sufficient reserves. Most experienced STR investors hold 3–4 months of PITIA (principal, interest, taxes, insurance, association dues) as a cash reserve before acquiring an STR asset with meaningful seasonality.
Step 5 — Subtract Operating Costs to Get NOI
Gross revenue is not what you make — it's the starting point. Net Operating Income (NOI) is what you actually earn before mortgage payments, and it's what drives cap rate and cash-on-cash return.
Cleaning (8 turns/mo avg × $130 per clean × 12 months): ~$12,480
Supplies and restocking: ~$1,200/year
Utilities (1.5–2× owner-occupied): ~$4,200/year
Maintenance reserve (1.5% of property value): ~$5,250 on $350K
Property management (if outsourced 25%): ~$11,250/year
Total operating costs (self-managed): ~$24,480 = 54% of $45K gross
Total operating costs (professionally managed): ~$35,730 = 79% of $45K gross
The rule of thumb that circulates in STR investor communities is that operating costs run "35–50% of gross." This is roughly accurate for self-managed properties, but it understates total costs for many investors because it excludes a realistic maintenance reserve and sometimes understates cleaning costs in high-frequency-turnover markets. Build your own operating cost stack from the line items above rather than applying a single percentage estimate.
How STRInvest Automates This for Any Property
The manual process described in this guide takes 3–6 hours per property when done rigorously — pulling comps, counting calendar availability, building the 12-month model, calculating the operating cost stack. That's the right approach for a property you're seriously considering under contract. But it's not feasible for the initial screening of 20–30 properties to find the 3–5 worth analyzing deeply.
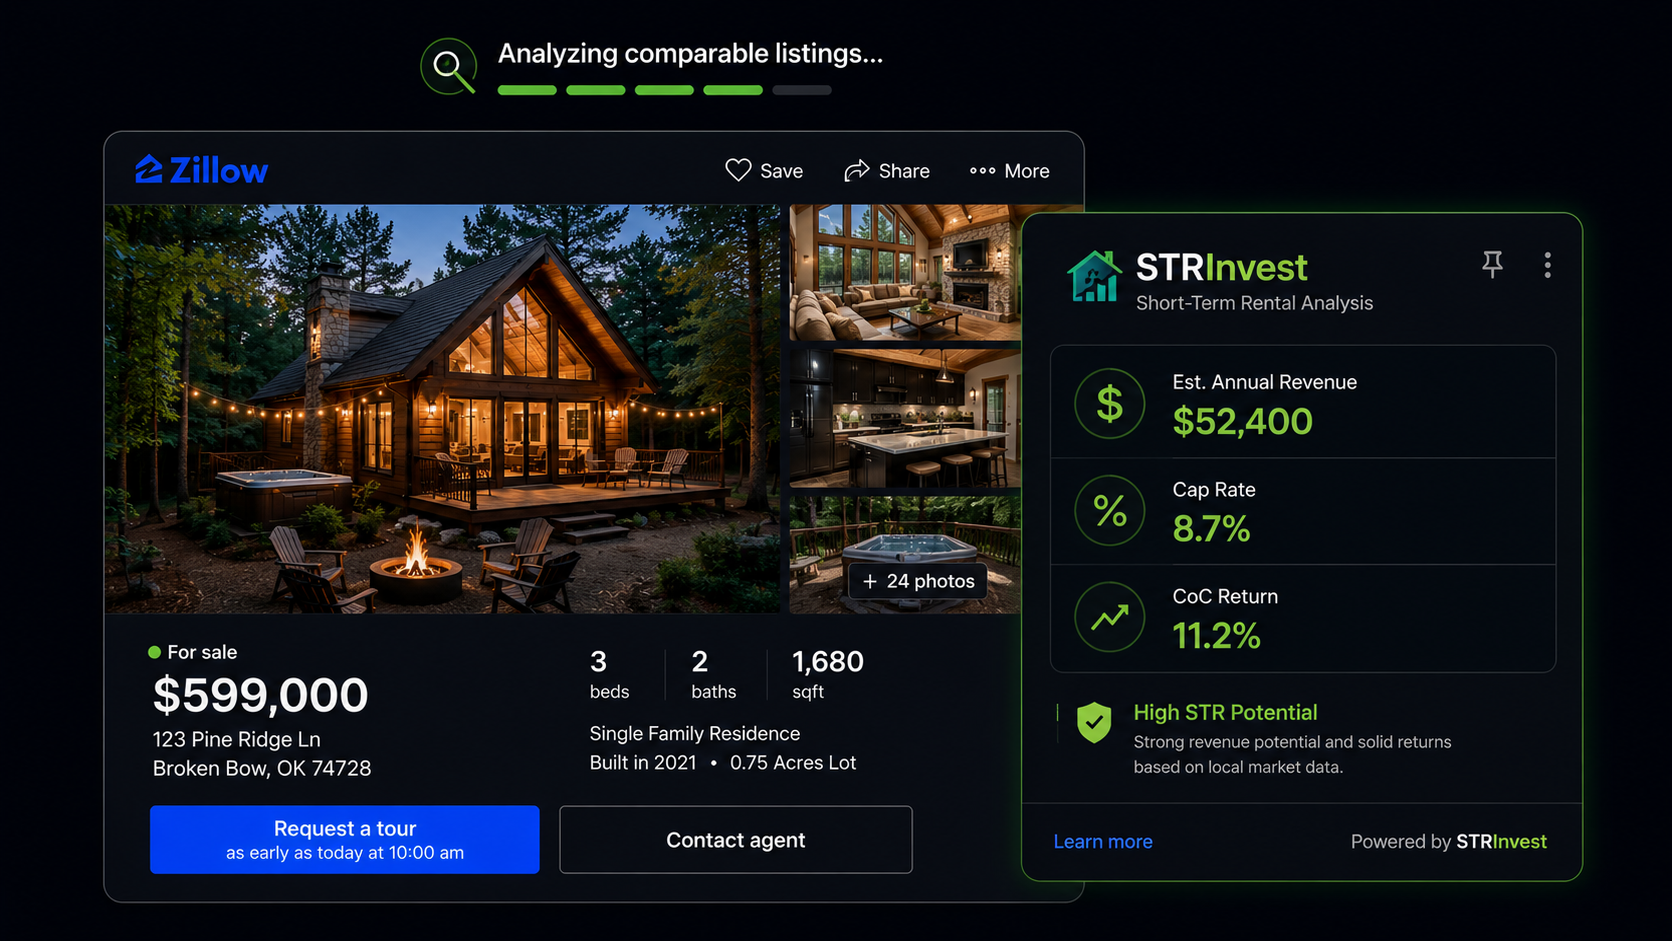
STRInvest solves the screening problem. When you open a property on Zillow or Redfin, the extension automatically overlays:
- Estimated annual gross Airbnb revenue — calculated from comparable active listings in the same ZIP, adjusted for bedroom count and the market's trailing occupancy rate
- Estimated cap rate — using conservative operating cost assumptions standard for the market type
- Cash-on-cash return — calculated with your financing inputs (down payment %, rate, term) applied to the estimated NOI
- STR regulation status — the municipality's current permit classification, so you can screen out legally non-viable properties immediately
The workflow: use STRInvest to screen listings and identify the ones that clear your minimum return thresholds (e.g., cap rate ≥7%, CoC ≥8% at 55% stress occupancy). Then apply the full manual analysis from this guide to the 3–5 properties that pass that screen. You invest deep analysis time only where it's likely to produce a deal, rather than building full models for every listing you browse.
Screen any Zillow listing for STR revenue potential in seconds
STRInvest shows estimated Airbnb revenue, cap rate, and cash-on-cash return on every Zillow and Redfin listing — so you spend deep due diligence time only on properties that clear your return thresholds.
Add to Chrome — Free →3 free analyses/month · Pro at $9.99/mo