The single most common mistake in STR investment underwriting is modeling gross revenue and mortgage payments — and stopping there. The result is an investment that looks profitable on paper and bleeds cash in reality. Operating costs are the part of the equation that separates investors who build wealth through short-term rentals from investors who learn an expensive lesson about why "it pencils" isn't the same as "it works."
This guide is the complete operating cost model that experienced STR investors use before closing on any property. Every line item, with realistic ranges, and the math on the biggest decision: self-manage or hire a professional.
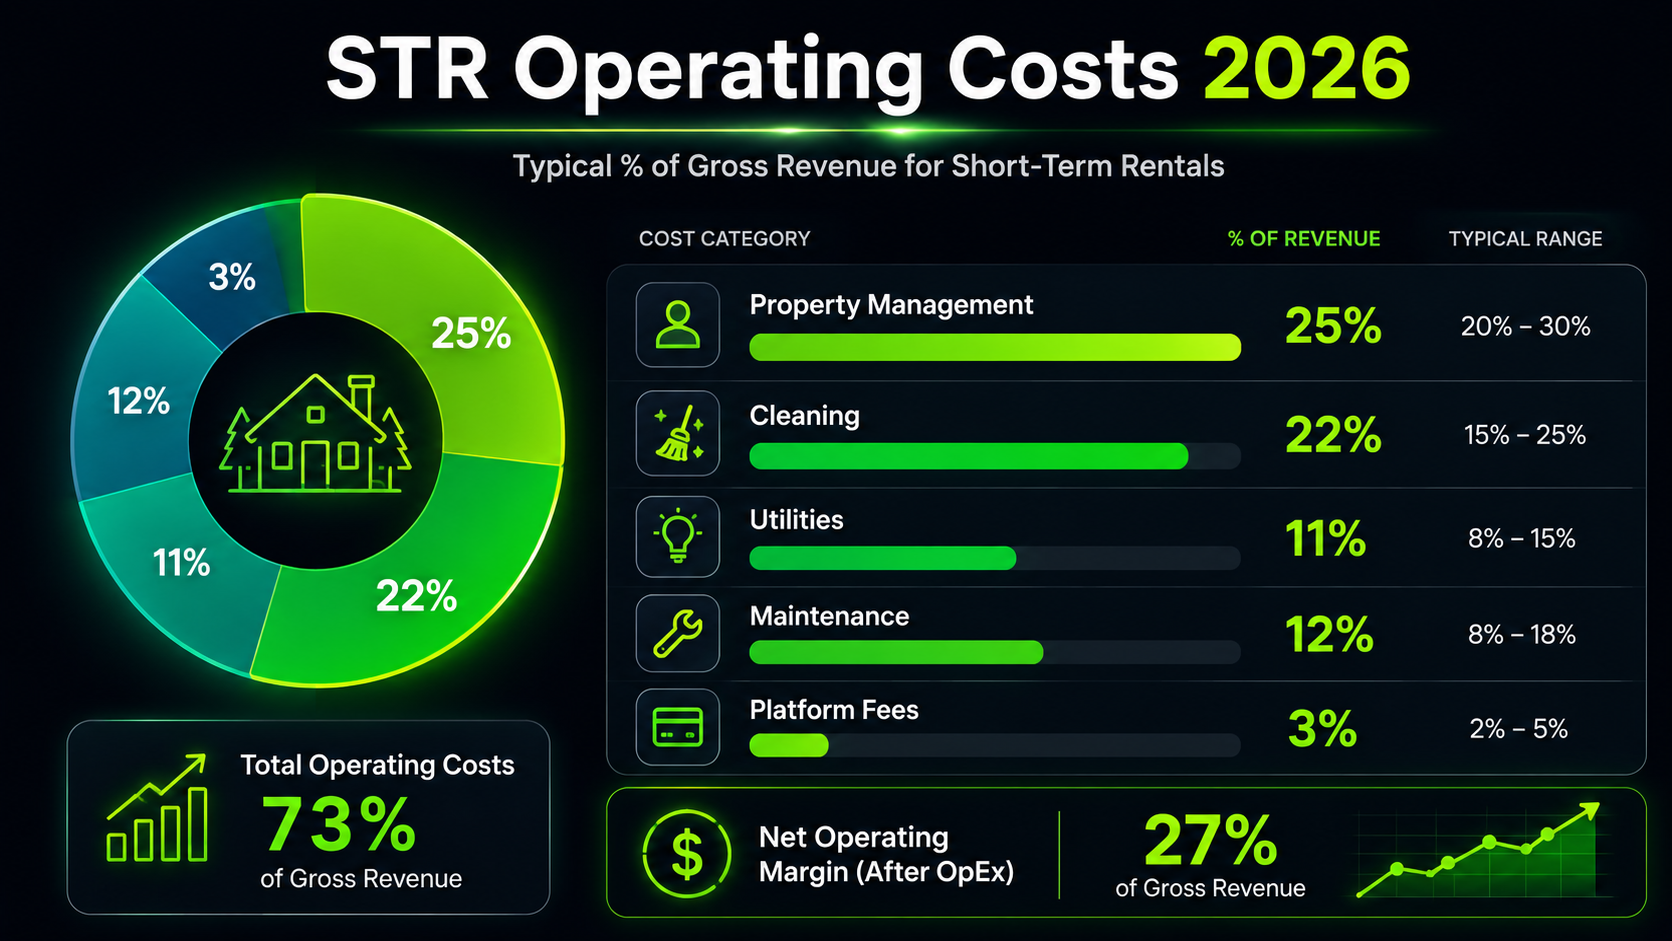
The Full Cost Stack of an STR
STR operating costs fall into two buckets: fixed (costs that don't change with occupancy) and variable (costs that scale with the number of guests and bookings).
| Cost Line Item | Low Range | Mid Range | High Range | % of Gross (mid) |
|---|---|---|---|---|
| Property management (full-service) | 18% | 25% | 30% | 25% |
| Cleaning (annual) | $6,000 | $10,000 | $18,000 | 22% |
| Platform fees (Airbnb 3%) | $900 | $1,350 | $1,800 | 3% |
| Utilities (annual) | $2,400 | $4,800 | $8,400 | 11% |
| Supplies and consumables | $800 | $1,500 | $2,400 | 3% |
| Maintenance reserve (1.5% of value) | $3,750 | $5,250 | $9,000 | 12% |
| Linen replacement | $800 | $1,800 | $3,000 | 4% |
| Property insurance (STR rider) | $1,200 | $2,400 | $4,200 | 5% |
(Ranges based on a 2–3BR STR property with $40,000–$55,000 gross annual revenue. PM cost shown for full-service professional management.)
The 35–50% rule of thumb: The commonly cited "STR operating costs are 35–50% of gross revenue" applies to self-managed properties. If you use a full-service property manager, total operating costs (including PM fees) typically run 55–70% of gross revenue. The difference — 15–20 percentage points — represents the PM's margin on top of the underlying operating costs. This is the real financial cost of passive STR ownership.
Property Management Fees: Full-Service vs. Co-Host
Property management is the largest variable cost for most non-self-managed STR investors, and it exists on a spectrum of service levels with very different price points.
Full-service property management
A full-service STR property manager handles everything: listing creation and optimization, dynamic pricing, guest communication (24/7 response), check-in coordination, cleaning coordination and quality control, maintenance coordination and vendor relationships, supply restocking, and financial reporting. On a $50,000 gross revenue property, a 25% PM fee costs $12,500/year. The investor's active role is essentially zero beyond reviewing monthly statements and approving major maintenance expenses. This is the true passive STR ownership model — but the return profile after PM fees more closely resembles a LTR investment than an actively managed STR.
Co-host model
A co-host handles guest communication, check-in coordination, and minor issue resolution — but does not coordinate cleaning or maintain a vendor network. The property owner handles cleaning coordination directly (using their own cleaning team) and manages supply restocking. This splits the labor differently: the co-host takes the time-sensitive guest-facing work; the owner manages the operational logistics. Co-hosts typically charge 10–20% of gross. On a $50,000 gross property, a 15% co-host fee costs $7,500/year — saving $5,000–$7,500 annually vs. full-service, but requiring 3–5 hours/week of active owner involvement for cleaning and supply coordination.
Self-management
Self-management eliminates the PM fee entirely but requires significant active time investment. The typical self-managed STR owner spends 5–15 hours per week per property on guest messaging, cleaning coordination (scheduling, quality checks), supply restocking, pricing adjustments, maintenance coordination, and review management. At the low end (5 hrs/week), self-management is comparable to a part-time side project. At the high end (15 hrs/week), it is effectively a second job. The financial benefit is real — saving $10,000–$15,000/year in PM fees on a $50K gross property. The practical constraint is that self-management is only feasible if you live within 60–90 minutes of the property.
Regional variance matters: markets with high PM supply density (Smoky Mountains, Gulf Coast, Orlando) often have more competitive fee structures, with full-service options as low as 18–22%. Urban markets and smaller STR markets with fewer professional managers often run 28–35% for comparable service.
Cleaning Costs: How to Model Them Accurately
Cleaning is the second-largest operating cost after property management, and it's the cost most investors underestimate because they think about it per-clean rather than at the annual level.
Where:
Estimated Annual Bookings = (365 × Occupancy Rate) ÷ Average Stay Length
Example: (365 × 0.68) ÷ 3.5 nights avg stay = 71 bookings/year
71 bookings × $145 per clean = $10,295 annual cleaning cost
The average cost per clean varies by property size and market: $80–$130 for a 1–2BR, $130–$200 for a 2–3BR, $180–$300+ for a large cabin or home. In high-labor-cost markets (coastal California, NYC suburbs), add 30–40% to these figures.
The cleaning fee you charge guests is separate from the cleaning cost you pay your cleaner — and the spread between them is a meaningful revenue lever. Some STR operators charge guests a cleaning fee that exceeds the actual cleaning cost, turning the cleaning fee into a profit center. Others price it at cost or below to improve short-stay conversion (lower cleaning fees encourage 1–2 night bookings). Understand the trade-off for your specific market before setting your cleaning fee structure.
Self-cleaning vs. outsourcing: Cleaning the property yourself saves $6,000–$15,000/year for an active STR, but costs 2–4 hours per turn and creates a scheduling dependency (you must be available within hours of every checkout). Most investors who start self-cleaning switch to outsourcing within 6–12 months when the operational constraint becomes too restrictive. Factor the outsourced cleaning cost into your underwriting, not the optimistic self-cleaning scenario.
Supplies, Restocking, and Consumables
Initial setup costs and ongoing consumable expenses are distinct but both frequently underbudgeted.
Initial furnishing and setup: Furnishing and equipping a 2BR STR from scratch typically costs $8,000–$18,000 depending on quality tier and market. A 3–4BR property in a market where design and amenity quality drives ADR premiums (Joshua Tree, Asheville, luxury cabin markets) may require $20,000–$35,000 in initial setup investment. This is a capital cost that should be amortized over 5–7 years in your return model, not treated as a one-time sunk cost.
Monthly consumables: Toiletries (shampoo, conditioner, body wash, soap), paper goods (toilet paper, paper towels, tissues), coffee and basic pantry supplies, cleaning products for cleaner use, and air fresheners typically run $60–$150/month for a 2–3BR property. At $100/month, that's $1,200/year — a line item most first-time investors miss entirely from their operating model.
Linen replacement: Guest linens (sheets, towels, bath mats) experience accelerated wear from frequent washing at high temperatures. Budget $1,500–$3,000/year for linen replacement on an active STR — significantly more than what a single family household spends on the same items over a decade.
Utilities and Recurring Services
Guest utility consumption is consistently underestimated by first-time STR investors because it's invisible until the first few utility bills arrive.
Why guests use 1.5–3× more utilities than owner-occupants
Guests don't pay the utility bill — they have no financial incentive to conserve. Air conditioning runs all day regardless of whether anyone is home. Hot water heaters work overtime with multiple showers per day. Smart TVs stream continuously. Laundry machines run daily during turnovers. In colder markets, heat runs at high settings even in mild weather. A property that costs $180/month in electricity as an owner-occupied home may cost $350–$500/month as an active STR with full summer occupancy.
| Utility/Service | Monthly Cost | Annual Cost | Notes |
|---|---|---|---|
| Electricity | $180–$420 | $2,160–$5,040 | Higher in HVAC-heavy markets |
| Water/sewer | $60–$120 | $720–$1,440 | Pool/hot tub adds $40–$80/mo |
| Internet (high-speed) | $70–$120 | $840–$1,440 | Non-negotiable for ratings |
| Streaming services | $25–$50 | $300–$600 | Netflix + one other platform |
| Landscaping | $100–$250 | $1,200–$3,000 | For properties with outdoor spaces |
| Pool/hot tub service | $120–$220 | $1,440–$2,640 | Strong ADR driver, worth separate model |
| Gas | $40–$120 | $480–$1,440 | If applicable |
Total utility costs for a 2–3BR STR without a pool typically run $350–$700/month ($4,200–$8,400/year). A property with a private pool or hot tub — which can command 20–35% ADR premiums — adds $200–$400/month to this figure. Model whether the ADR premium from the amenity exceeds its operating cost before marketing it as a selling point.
Platform and Booking Fees
Platform fees are the most transparent operating cost in the STR stack — but they're not the only booking-related expense.
- Airbnb host fee: 3% of the booking subtotal (nightly rate × nights). On $45,000 annual gross revenue, this is $1,350/year.
- VRBO/Vrbo host fee: Two models — 5% commission or 8% flat rate per booking. At comparable revenue levels, VRBO typically costs slightly more than Airbnb due to the higher fee structure.
- Multi-platform management tools: If you list on 3+ platforms to maximize occupancy (Airbnb, VRBO, Booking.com, direct), a channel manager and PMS tool is required to prevent double-bookings. Tools like Hospitable, Hostaway, or Guesty cost $50–$200/month depending on property count and features. The incremental 8–12% occupancy lift from multi-platform listing typically more than justifies this cost.
- Direct booking channel costs: Website hosting ($15–$30/month), payment processing (Stripe/Square at 2.9% + $0.30 per transaction), and email marketing software ($20–$50/month for Mailchimp or equivalent).
Maintenance and CapEx Reserve
Maintenance is the most commonly under-reserved operating cost in STR underwriting. The standard LTR rule of thumb — 1% of property value per year — understates the maintenance requirement for an actively-rented STR, where guest traffic accelerates wear on every mechanical system and furnishing.
Example: $350,000 property
1.5% = $5,250/year ($437/month)
2.0% = $7,000/year ($583/month)
This covers routine maintenance + amortized CapEx
(roof replacement, HVAC, water heater, appliances)
If your deal doesn't pencil with a 1.5% maintenance reserve, reduce your offer price.
The most common major CapEx items and their typical useful lives under active STR operation:
- HVAC system: 10–12 years with regular filter changes and annual service (shorter than the 15-year LTR average due to continuous guest operation)
- Water heater: 8–10 years (standard tankless or tank-style)
- Roof: 15–20 years (same as standard residential, assuming proper maintenance)
- Appliances: 5–8 years for actively-used refrigerator, washer/dryer, dishwasher (consumer-grade appliances, not commercial)
- Exterior paint and deck maintenance: 5–7 years (climate-dependent)
Self-Manage vs. Professional Management: The Real Math
Here is the complete side-by-side model for a $55,000 gross revenue property at 25% PM fee:
Gross revenue: $55,000
Platform fees (3%): − $1,650
Cleaning (annual): − $11,000
Supplies/consumables: − $1,500
Utilities (annual): − $5,400
Maintenance reserve: − $6,000
Linen/small equipment: − $2,000
─────────────────────────────────
Net Operating Income: $27,450
NOI Margin: 50%
PROFESSIONALLY MANAGED (25% PM):
Gross revenue: $55,000
PM fee (25%): − $13,750
Platform fees (3%): − $1,650
Cleaning (PM-coordinated):− $9,900
Supplies/consumables: − $1,500
Utilities (annual): − $5,400
Maintenance reserve: − $6,000
Linen/small equipment: − $2,000
─────────────────────────────────
Net Operating Income: $14,800
NOI Margin: 27%
The difference: $27,450 vs. $14,800 NOI — a $12,650/year gap driven almost entirely by the PM fee. At a $350,000 acquisition price, self-management produces a 7.8% cap rate; professional management produces a 4.2% cap rate. The same property goes from a solid investment to a barely-viable one depending on how you operate it.
Break-even analysis: If self-management requires 10 hours/week, that's approximately 520 hours/year. The PM fee saved is $12,650. The implied hourly value of your self-management time is $12,650 ÷ 520 = $24.33/hour. For most professionals with market-rate hourly earnings above $30–$40/hour, the time is worth more than the fee saved — which means professional management produces a better risk-adjusted return on total invested resources. For investors with lower opportunity cost for their time, or who genuinely enjoy the operations, self-management is financially superior.
How to Build Your Operating Cost Model Before Buying
The six-line model you can build in 15 minutes for any property you're considering:
STRInvest's cap rate and cash-on-cash calculations on Zillow and Redfin listings already apply these operating cost assumptions to the estimated STR revenue for the property — giving you a pre-screened return estimate before you even pull up a spreadsheet.
Screen listings with realistic operating costs already applied
STRInvest shows cap rate and cash-on-cash return using conservative, fully-loaded operating cost assumptions — not just gross revenue ÷ price. Know which listings actually pencil before you start your analysis.
Add to Chrome — Free →3 free analyses/month · Pro at $9.99/mo