Why most STR analysis takes too long
A proper short-term rental investment analysis requires pulling data from at least four sources: the listing itself (purchase price, taxes, HOA), an Airbnb market data tool (comparable revenue), a regulatory database (local STR rules), and a financial model (cap rate, cash-on-cash). Doing this manually for a single property takes 30–60 minutes. Most investors either skip it or only look at the most promising deals.
The problem is that you don't know which deals are promising until you've run the numbers. When analysis is expensive, investors rely on gut feel — and that's how you end up buying in a market that was banned from Airbnb six months after closing.
| Metric | Weak Deal | Strong Deal |
|---|---|---|
| Cap rate | < 4% | 6-10%+ |
| Cash-on-cash return | < 5% | 8-15%+ |
| Gross rent multiplier | > 15x | < 10x |
| Projected annual revenue | < 1.5% of purchase price | 2-3%+ of purchase price |
| Occupancy rate | < 55% | 68-80%+ |
| ADR (avg daily rate) vs. market P50 | Below market median | At or above P50 |
| Expense ratio | > 45% | 30-38% |
| Break-even occupancy | > 70% | < 50% |
| Payback period | > 20 years | < 12 years |
What STRInvest shows you
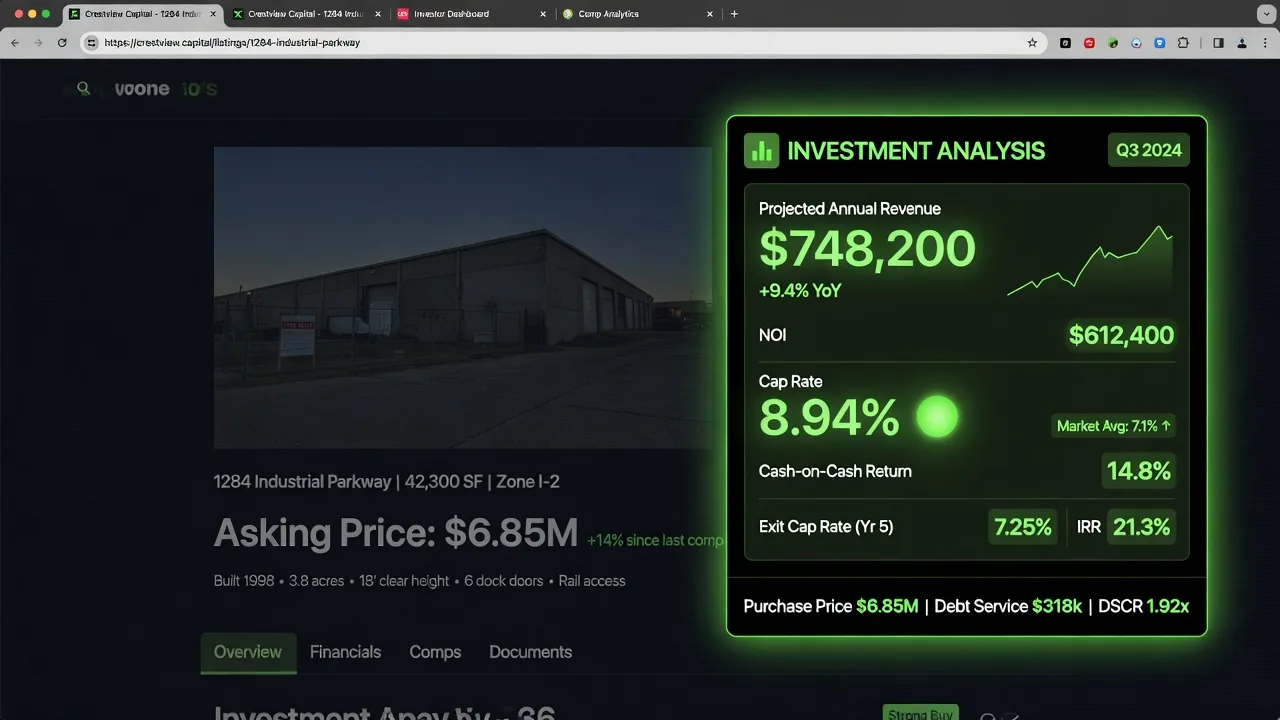
STRInvest is a Chrome extension that injects a full investment analysis panel directly onto any Zillow, Redfin, or Realtor.com listing. When you install it and open a property page, you'll see:
- Projected Airbnb revenue — monthly and annual estimates based on comparable active listings in the same market
- Cap rate — net operating income divided by purchase price, expressed as a percentage
- Cash-on-cash return — annual pre-tax cash flow divided by total cash invested (including down payment and closing costs)
- Local STR regulations — whether short-term rentals are permitted, restricted, or banned in that jurisdiction
- Comparable Airbnb listings — nearby active STRs used as the basis for the revenue estimate
- HOA and restriction flags — warnings if the HOA or building rules prohibit short-term rentals
Step-by-step: your first analysis
Open the STRInvest web app
Go to the STRInvest web app in any browser. Nothing to install. Your first analysis is free, and a free account unlocks 3 analyses a month, no credit card required.
Paste a Zillow, Redfin, or Realtor.com link
Copy the URL of any property listing on the three supported platforms and paste it into the analyzer. STRInvest reads the listing (beds, location, price) straight from the page. If a listing hides its price, you can type it in and it recalculates.
Read the scorecard
The full investment scorecard loads in seconds: revenue projection, cap rate, cash-on-cash return, and regulation status, with the comparable Airbnb listings behind the revenue estimate shown right there.
Adjust assumptions to match your deal
Editable sliders for down payment percentage, mortgage rate, and occupancy rate let you match your financing terms, and the analysis updates in real time. A 20% down at 7.5% reads very differently than a 30% down at 6.8%. Save the deal to your portfolio to compare it against others later.
Reading the numbers: what's a good deal?
There's no universal threshold, but here are the benchmarks most experienced STR investors use:
- Cap rate: 6%+ is considered good for STR. Below 5% is tough to justify unless the market has strong appreciation upside.
- Cash-on-cash return: 8–10%+ is the target range for most investors. Anything above 12% is exceptional. Below 6% means your capital is better deployed elsewhere.
- Projected monthly revenue: Should comfortably cover your mortgage, property management, and operating costs with margin left over.
How accurate are the projections?
STRInvest pulls data from actual Airbnb comparable listings in the same market — properties with similar bedroom count, location, and amenities. The revenue estimate is based on what comparable listings are actually earning, not theoretical market averages.
Like any projection, it's an estimate. Actual performance depends on your listing quality, pricing strategy, amenities, and how you manage the property. Use the projection as a benchmark, not a guarantee, and verify it by checking the comparable Airbnb listings STRInvest shows behind each revenue estimate.
When to go pro
The free plan gives you 3 analyses per month, enough to evaluate deals you're already seriously considering. If you're actively screening markets or running through MLS listings at volume, the Pro plan gives you unlimited analyses for $9.99/month plus a saved portfolio, side-by-side deal comparison, price-drop and rule-change alerts, and shareable reports. One good deal more than pays for a year of the subscription.