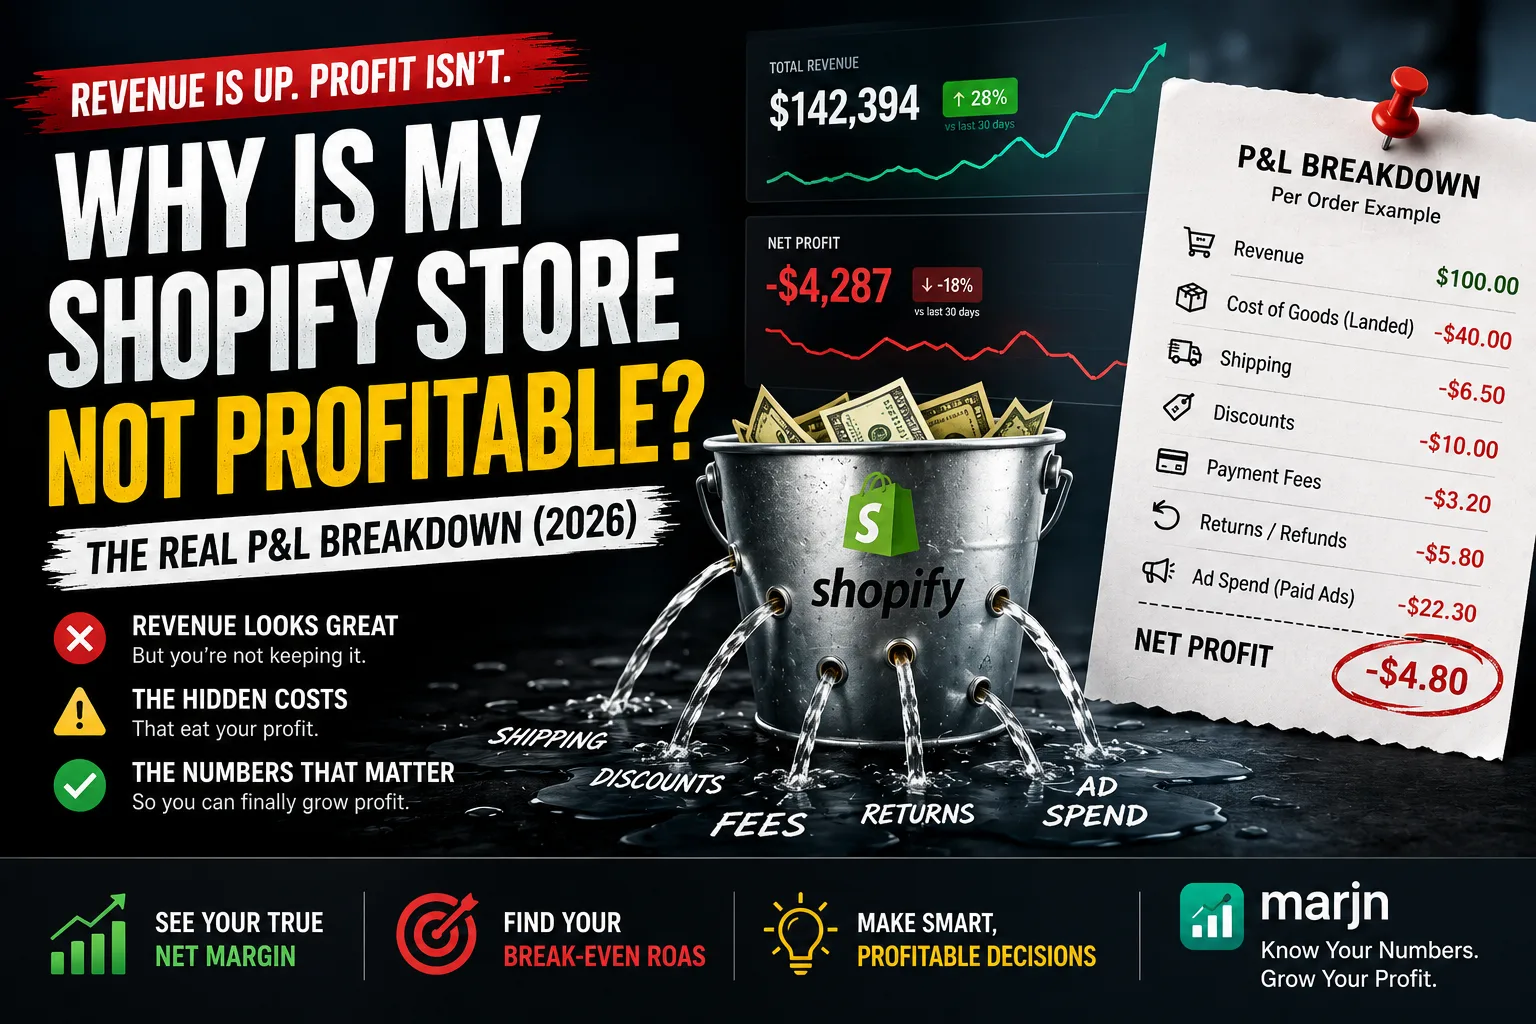
In one line: A Shopify store makes sales but no profit because revenue is only the top line. After the landed cost of goods, payment fees, shipping, discounts, returns, and ad spend come out, little or nothing is left. Shopify Analytics shows revenue, not true net profit, so the dashboard can look healthy while the bank account does not. To fix it, build a per-order profit-and-loss that includes ad spend, then price and advertise off that number instead of revenue.
Where does the money go on a Shopify order? In order: cost of goods, payment processing fee, shipping, discounts, expected returns, then advertising. Advertising is usually the largest and most volatile line, and it is the one your dashboard leaves out entirely.
The short version
- Revenue growing while profit shrinks is a margin problem, not a sales problem.
- Six lines stand between a sale and profit: goods, fees, shipping, discounts, returns, and ads.
- The median public direct-to-consumer brand ran a negative operating margin last year on a healthy-looking 47 percent gross margin (Eightx, SEC data, 2026). Big brands hit this wall too.
- Shopify Analytics reports revenue and, at best, a partial gross profit. It never sees your ad spend.
- The number that should run your business is contribution margin per order, and you can rebuild it by hand or read it from a tool.
There is a specific moment most store owners recognize. Orders are coming in, the Shopify homepage shows a tidy upward line, and yet payroll and restocking feel tighter every month. The instinct is to sell more. More sales into the same math usually makes the hole deeper, because the problem is not how much you are selling. It is how little of each sale you keep.
To see why, you have to follow a single order all the way down. Shopify shows you the top of that journey and hides most of the middle. Let us put the whole thing on the table.
Revenue is the top line, and it is the only line Shopify makes obvious
When a customer pays $100, Shopify records $100 of revenue. That number is real, and it is also the least useful number you own, because none of it is yours yet. Everything that follows is the story of that $100 leaving.
Most owners know this in theory. The trouble is that Shopify's default reporting stops almost immediately after revenue. It will show orders, sessions, conversion rate, and average order value. If you have carefully entered a cost-per-item for every variant, it will show a gross profit. It will not show what you paid to acquire the customer, it does not always pull your payment fees correctly, and it reports shipping as an average rather than per order. So the "profit" many owners glance at is a partial gross figure with the biggest cost of all left out.
That is the core of the answer to "why is my store not profitable." You have been reading a revenue tool as if it were a profit tool. Here is what a profit tool would show you instead.
The six lines between a sale and profit
Take one $100 order and walk it down. Your exact numbers will differ, but the shape holds for almost every store.
1 Cost of goods sold (the landed cost)
This is what the product actually cost you to have in hand: the item itself, inbound freight, and any duties. The mistake here is using the sticker price from a supplier instead of the landed cost. A mug that costs $6 from the factory might land at $8.50 once you count the freight and the customs on the shipment. If you priced off $6, every unit is quietly $2.50 worse than you think.
Say landed cost on this order is $35. You are down to $65.
2 Payment processing fees
Every card charge takes a cut. Shopify Payments runs 2.9% plus 30 cents on the Basic and Shopify plans, 2.6% plus 30 cents on Advanced, and 2.4% plus 30 cents on Plus (Bloom Analytics, 2026). On a $100 order that is roughly $3.20. Small on one order, but it never stops, and it scales with revenue rather than profit.
You are down to about $61.80.
3 Shipping and fulfillment
What you charge for shipping and what it costs you are rarely the same. Free shipping is a discount you pay on every order. Even when the customer pays, the box, the label, the pick-and-pack labor, and the dimensional weight surcharge add up. Assume $8 of real shipping cost you are not fully recovering.
You are down to about $53.80.
4 Discounts and promotions
The welcome code, the site-wide sale, the abandoned-cart offer. Discounts feel like a marketing expense but they come straight out of margin, and they cluster on your most-promoted products. If this order used a 15% code, that is $15 gone from a sale you already thinned out with the three lines above.
You are down to about $38.80. And notice: your dashboard still says this was a $100 order.
5 Returns and refunds
Not every order is returned, but returns are a real average cost across all of them. Processing a single return, counting inbound shipping, labor, restocking, and write-downs, runs $15 to $30 or more per returned item (Bloom Analytics, 2026). Spread across every order at a typical return rate, that might be $3 to $5 of expected cost baked into this one.
Call it $4. You are down to about $34.80.
6 Advertising, the line your dashboard never shows
Here is where most stores actually lose. If you spend money on Meta or Google to bring customers in, a share of every order's revenue was really the cost of getting that customer to the checkout. Blend it across your orders, or attribute it directly, and this is usually the single largest deduction of all.
If your advertising works out to $30 of cost against this order, you have $4.80 left. If it works out to $40, you just lost money on a sale your dashboard is celebrating.
Why revenue can rise while profit falls
The walkthrough above is a snapshot of one order. The reason profit erodes over time is that the sixth line, advertising, keeps getting more expensive.
Ad prices are not flat. Internet ad prices are up more than 30 percent since the end of 2022, and Meta CPMs climbed for years before peaking above $25 in late 2025 (Eightx, 2026). Median direct-to-consumer brands now spend somewhere between $130 and $156 to acquire a single customer, roughly a 60 percent increase over five years (Eightx, 2026). If the cost to acquire a customer rises and your price and product cost stay put, the sixth line grows while the first five hold, and your margin quietly bleeds out.
This is why scaling can feel like running to stand still. You add revenue by spending more on ads, but the incremental customer costs more than the last one, so you add sales and subtract profit at the same time. Cold paid traffic is often the least profitable channel a store has. In one 2026 analysis, cold Meta acquisition carried a negative 22 percent contribution margin, meaning those customers cost more than they were worth on the first order, while email and SMS retention ran at a positive 77 percent (Eightx, 2026). A store that grows entirely on cold ads is buying revenue at a loss and hoping the second purchase makes it back.
None of this is a sign you are doing something uniquely wrong. It is the default gravity of ecommerce in 2026, and it catches large, sophisticated brands too. The median public direct-to-consumer company, brands with finance teams and dashboards you do not have, ran a negative 2.4 percent operating margin last year on a gross margin near 47 percent (Eightx, SEC filings, 2026). Their gross margin looked fine. Their bottom line was underwater. If it can happen to them with full visibility, it can happen to you with a dashboard that hides half the costs.
See your real margin, per product, inside Shopify
Marjn rebuilds the profit-and-loss above from your own Shopify order revenue, your landed cost, and your Meta ad spend, then answers margin questions right inside Shopify Sidekick. Ask which products lose money after ads and get a real number. Free plan, no card.
Get Marjn on the Shopify App Store →Gross margin, contribution margin, and net margin are not the same
A lot of the confusion comes from three words that get used interchangeably and mean very different things. Getting them straight is most of the battle.
| Term | What it subtracts | What it leaves out |
|---|---|---|
| Gross margin | Cost of goods only | Fees, shipping, returns, and ad spend |
| Contribution margin | All variable costs to fulfill and acquire the order, including ad spend | Fixed overhead (rent, salaries, software) |
| Net margin | Everything, including fixed overhead | Nothing, this is the true bottom line |
Shopify's cost-per-item field, when filled in, gets you a version of gross margin. That is why a store can show a 70 percent gross margin on the dashboard and still lose money on the order: gross margin does not know about the ad spend, the discount, or the shipping. The number you actually need to run ads and set prices is contribution margin, because it is the first number that includes the cost of acquiring the customer. A product with a positive gross margin and a negative contribution margin is a product you are paying to sell.
There is a clean way to know how much return you need from ads just to break even. Break-even ROAS equals one divided by your gross margin. At a 50 percent margin you need a 2.0x return to break even; at 33 percent you need 3.0x; at 25 percent you need 4.0x. Anything below that number is a loss, no matter how good the ROAS looks in isolation. We walk through a real case of a 3.8x ROAS that still lost more than a thousand dollars in why a good ROAS can still lose you money.
How to find your own number
You do not need software to do this once by hand, and doing it once is clarifying. Pick a normal month and work through it.
1 Pull revenue after discounts
Start with net sales for the period, meaning gross sales minus discounts and refunds. Shopify gives you this directly.
2 Subtract the true cost of goods
Use landed cost, not supplier sticker price. If your Shopify cost-per-item field is empty or wrong for some variants, this is where your margin math silently breaks, so fix the worst offenders first.
3 Subtract fees, shipping, and expected returns
Payment fees you can pull from your processor. Shipping should be your real cost, not what you charged. Returns can be an average rate times an average cost per return until you track it precisely.
4 Subtract total ad spend
Take everything you spent on Meta, Google, and any other paid channel that month. Do not try to attribute it perfectly on the first pass. Blended is fine to start: total ad spend against total contribution.
5 Read the number that is left
What remains is your contribution profit for the month. Divide it by revenue and you have your contribution margin. Compare it to the benchmark: an average ecommerce net margin is around 10 percent, strong operators clear 20 percent, and under 5 percent is the danger zone (TrueProfit benchmark, 2025). If your number is negative, you now know exactly why the bank account is falling while the dashboard is green.
Doing this by hand once tells you the store-wide truth. The catch is that it goes stale the moment you change a price, run a sale, or shift ad budget, and it can not tell you which products are the losers hiding inside a healthy average. That is the difference between a monthly spreadsheet and a live view. When you want the per-product answer on demand, a tool that reads your live Shopify revenue, your landed cost, and your ad spend can give you the same P&L above for any product, any time. That is exactly what Marjn does, and it answers the question inside Shopify Sidekick so you never leave your admin. For a side-by-side of what Shopify's own tools know versus what Marjn adds, see Marjn vs Shopify Analytics and Sidekick.
The most common places the money hides
When a store owner finally runs this math, the loss almost always concentrates in one of a few spots. In rough order of how often they are the culprit:
- Ad spend on cold traffic. The single biggest and most volatile line, and the one Shopify never shows. If your blended contribution margin is negative, this is the first place to look.
- Your best sellers. Counterintuitive but common: the products you promote most carry the heaviest discount and ad load, so a bestseller can be your biggest loser. We break down that trap in why your bestseller is your biggest loser.
- Free shipping you are not recovering. A margin leak on every single order, easy to miss because it never shows up as a line item.
- A wrong or empty cost-per-item field. If the landed cost is missing for some variants, every downstream margin number for them is fiction.
- Discount stacking. A welcome code on top of a sale on top of free shipping can wipe out margin on an order that still counts as full-price revenue on the dashboard.
The fix is never "sell more." It is to find the specific line and the specific products that are underwater, then change the price, cut the discount, or turn off the campaign that is buying revenue at a loss.
Frequently asked questions
Why is my Shopify store making sales but no profit? Revenue is only the top line. After landed cost of goods, payment fees, shipping, discounts, returns, and advertising, what is left is often small or negative. Shopify Analytics reports revenue and orders, so a store can look healthy on the dashboard while the bank balance says otherwise. The fix is a per-order profit-and-loss that includes ad spend.
Does Shopify show my profit? Not fully. It shows revenue, orders, and, if you have filled in cost-per-item for every variant, a gross profit figure. It does not include ad spend, it does not always pull gateway fees correctly, and it averages shipping. So the dashboard number is a partial gross figure, not true net profit.
What is a good net profit margin for an ecommerce store? Around 10 percent is a common average, above 20 percent is strong, and under 5 percent is a danger zone. Dropshipping sits near the low end; branded direct-to-consumer brands can reach 25 to 45 percent. Your real number depends on your product costs and your cost to acquire a customer.
How do I calculate the true profit of a Shopify order? Start with order revenue after discounts, then subtract landed cost, the payment fee, real shipping cost, expected return cost, and the ad cost to acquire the sale. What remains is contribution profit. Do it across a period for your true store margin.
Why does my profit shrink as my revenue grows? Usually rising customer acquisition cost. Ad prices have climbed for years, so each new customer costs more. If you scale spend without watching contribution margin per order, you add sales and subtract profit at the same time, especially on cold paid traffic.