Most Airbnb hosts focus on one number: nightly rate. They pick a price that feels reasonable, turn on Smart Pricing, and hope for the best. The result is usually a listing that's either chronically underbooked (because it's priced too high) or fully booked at rates that leave thousands of dollars on the table every month.
Real revenue optimization is about understanding the three variables you actually control — and how they interact. This playbook gives you the framework, the math, and the tools to stop guessing and start maximizing.
The Airbnb Revenue Formula Every Host Must Know
Before you can optimize anything, you need to understand what you're optimizing. Airbnb revenue is determined by three variables — and only three:
ADR = Average Daily Rate (what you charge per night)
Occupancy Rate = % of available nights that are booked
Available Nights = nights your listing is open for booking
Example: $180/night × 72% × 30 nights = $3,888/month
This formula looks simple. But it has a profound implication: any change you make that improves two variables while hurting one can still be a net win — if the math works out. That's why blindly chasing 100% occupancy is almost always wrong.
Let's run the numbers on a real scenario. A host in Denver has a 2-bedroom listed at $120/night with 85% occupancy. That's $3,060/month. What happens if they raise their rate to $145/night and occupancy drops to 72%?
After: $145 × 0.72 × 30 = $3,132/month
Net gain: +$72/month — from fewer bookings, less work, more revenue
This is why understanding the formula matters more than any individual pricing tip. The goal isn't to be fully booked. The goal is to maximize revenue per available night.
Rate vs. Occupancy: Which Lever Matters More
The rate vs. occupancy debate is the central question of STR revenue management. The answer depends entirely on where you are in the price-sensitivity curve for your market.
In most Airbnb markets, the relationship between price and occupancy follows a curve: small price increases from a low base barely affect occupancy, but once you pass the market median, each additional dollar reduces your fill rate more steeply. The sweet spot — the point where revenue (rate × occupancy) is highest — typically sits between the P45 and P55 of your local market.
Key insight: AirPrice calculates the "sweet spot" price as the P45 of your local comp set — just below median, which research shows maximizes revenue without sacrificing significant occupancy. Being slightly below median means you beat most competitors on price while still capturing strong demand.
Here's a practical framework for deciding which lever to pull:
If your occupancy is below 60%
You have a demand problem, not a pricing problem. But it's likely still a pricing problem — you're priced above the market clearing rate. Check your price against the P25 of local comps. If you're above it, lower your rate until you're competitive. Every empty night is $0 revenue.
If your occupancy is 60–80%
This is the optimization zone. You have demand but room to improve. Run the rate × occupancy math at your current rate, then at +10% and +20%. If the product of the two still increases after the occupancy penalty, raise your rate. If it doesn't, hold or reduce slightly.
If your occupancy is above 80% consistently
You are almost certainly underpriced. A listing that's fully booked 3+ months in advance is a listing that could charge more. Raise your rate 15–25% immediately. Some bookings will fall through — that's expected and acceptable. Your revenue will increase.
If your occupancy is near 100%
You're leaving significant money on the table. At near-full occupancy, you have pricing power. Raise rates aggressively (25–40%) until occupancy stabilizes around 70–80%. The revenue math will improve substantially in almost every case.
RevPAN: The Metric That Actually Measures Performance
Occupancy rate is the most commonly discussed STR metric, but it's also the most misleading. Two listings can both report "75% occupancy" and have wildly different revenue outcomes depending on their nightly rates.
The metric that actually matters is RevPAN — Revenue Per Available Night:
Example A: $3,600 revenue ÷ 30 nights = $120 RevPAN
Example B: $3,600 revenue ÷ 30 nights = $120 RevPAN
Same RevPAN — but Example A charges $200/night at 60% occ,
Example B charges $120/night at 100% occ.
Example A has 40% fewer bookings but earns the same income.
This is a critical insight for hosts who are obsessing over occupancy. More bookings means more cleaning, more guest communication, more wear and tear on your property. If your RevPAN is the same at lower occupancy, the lower-occupancy outcome is strictly better for your time and your property.
Here are RevPAN benchmarks by market tier (based on AirDNA and Mashvisor 2025–2026 data):
| Market Tier | Typical 1BR RevPAN | Typical 2BR RevPAN | Typical 3BR RevPAN |
|---|---|---|---|
| Top 10 markets (NYC, Miami, SF) | $140–$220 | $210–$350 | $300–$500 |
| Secondary cities (Denver, Austin, Nashville) | $90–$140 | $130–$200 | $180–$280 |
| Tertiary / suburban markets | $55–$90 | $75–$130 | $110–$180 |
| Rural / destination markets | $70–$120 | $110–$180 | $160–$260 |
If your RevPAN is below the bottom of your market tier's range, you have a meaningful opportunity to increase revenue — either by raising rates, improving occupancy, or both.
The 4-Season Revenue Calendar
Revenue optimization isn't a one-time task. It's a calendar-based practice. The most consistently high-earning hosts treat pricing like a quarterly review, not a set-and-forget exercise.
Here's how to structure your annual revenue calendar:
| Season | Months | Rate Strategy | Minimum Stay | Action |
|---|---|---|---|---|
| Peak | Jun–Aug, Dec 20–Jan 5 | +30–50% above base | 3–5 nights | Set rates 60–90 days in advance, raise further 2 weeks out if still open |
| Shoulder (Spring) | Mar–May | +10–20% above base | 2 nights | Watch event calendar; Easter and spring break can spike to peak levels |
| Shoulder (Fall) | Sep–Nov | Base rate to +15% | 2 nights | Leaf-peeping markets (Oct) and Thanksgiving week are strong exceptions |
| Off-peak | Jan–Feb, Nov 1–19 | -10 to -20% below base | 1–2 nights | Consider longer-stay discounts (28+ nights) to fill gaps with monthly guests |
The biggest revenue mistakes happen at seasonal transitions. Hosts who forget to raise rates in May before summer demand kicks in lose significant income. Hosts who keep peak rates into October watch their occupancy crater. Use the month-by-month seasonal pricing guide to plan exact rate adjustments for each period.
Shoulder Season: Where the Real Money Is
Peak season is obvious. Everyone knows summer weekends in a beach market command high rates. The hosts who outperform their comp set don't just optimize peak — they extract maximum value from shoulder season, where most hosts leave money on the table.
Shoulder season optimization has three levers:
Event-driven surges
Local events — festivals, graduations, conferences, sports — create demand spikes in otherwise soft months. A listing in Nashville during CMA Fest in June should price like it's peak season for that week, even if the surrounding weeks are shoulder. Build a local events calendar and pre-set higher rates for those windows.
Last-minute discount windows
Shoulder nights that haven't booked 5–7 days out have a very low probability of booking at your standard rate. Rather than let them go dark, set automatic discounts of 15–25% for nights within 5 days. A discounted booking at $85 beats an empty night at $0 every time.
Monthly stay discounts
Off-peak months (January, February) are difficult to fill with weekend travelers. But remote workers and traveling professionals need housing for 28–60 days at a time. Offering a 30–40% monthly discount fills your calendar with stable, low-maintenance bookings that require a single check-in and check-out rather than 15–20 separate guest interactions.
Shoulder season reality check: A host earning $4,000/month in peak can easily earn $2,200–$2,800/month in shoulder season with the right strategy — or just $1,200–$1,500 with no strategy. The difference is almost entirely pricing and minimum stay configuration.
Length-of-Stay Pricing Strategy
Most hosts set one rate and offer a generic "weekly discount" or "monthly discount" without thinking about the economics of different stay lengths. This is a significant missed opportunity.
Here's the revenue math on different stay lengths for a listing with a $150/night base rate and $75 cleaning fee:
| Stay Length | Gross Revenue | Revenue After Cleaning | Effective Nightly Rate |
|---|---|---|---|
| 1 night | $225 ($150 + $75) | $150 | $150 |
| 2 nights | $375 ($300 + $75) | $300 | $150 |
| 3 nights | $525 ($450 + $75) | $450 | $150 |
| 7 nights (-10% disc) | $1,020 ($945 + $75) | $945 | $135 — one cleaning |
| 28 nights (-30% disc) | $3,225 ($3,150 + $75) | $3,150 | $112.50 — one cleaning |
The key insight: cleaning cost is fixed regardless of stay length. A 7-night booking at 10% discount generates more revenue per cleaning than four separate 2-night bookings — and requires only one guest interaction, one set of linens, and one turnover. Longer stays are more efficient, not just for the host's time but for the property itself.
Optimal minimum stay strategy by season:
- Peak season: 3–5 night minimum. Prevents weekend-only bookings that block weekdays.
- Shoulder season: 2 nights. Capture weekend trips while keeping calendar flexible.
- Off-peak: 1–2 nights on short notice (within 7 days), 2+ nights for advance bookings.
- Special events: Match minimum stay to the event duration (e.g., 3 nights for a 3-day festival).
How Cleaning Fees Silently Destroy Bookings
Cleaning fees are one of the most overlooked conversion killers on Airbnb. Guests compare total trip cost — not just nightly rate — and a high cleaning fee can make a competitively priced listing look expensive in search results.
The data is consistent: listings with cleaning fees above 25% of the nightly rate see materially lower booking rates, especially for short stays. Here's why:
When a guest searches for 2 nights at $150/night and sees a $100 cleaning fee, they're paying $400 total — an effective rate of $200/night. A competitor listing at $160/night with a $40 cleaning fee costs only $360 total — $180/night effective. The higher-rate listing wins on total price.
Example A: ($150 × 2 + $100) ÷ 2 = $200 effective
Example B: ($160 × 2 + $40) ÷ 2 = $180 effective
Example B wins despite a higher advertised rate — because the cleaning fee is lower.
The optimization: set your cleaning fee at or just below actual cleaning cost. If it's a short-stay market, consider absorbing some of the cleaning cost in a slightly higher nightly rate. You'll see improved conversion on 2–3 night stays without changing your total revenue per booking.
Using AirPrice to Find Your Revenue Ceiling
All the strategies above require one thing: knowing where the market actually prices. Without real comp data, you're estimating based on feel — and hosts who guess consistently undercharge or price themselves out of the market.
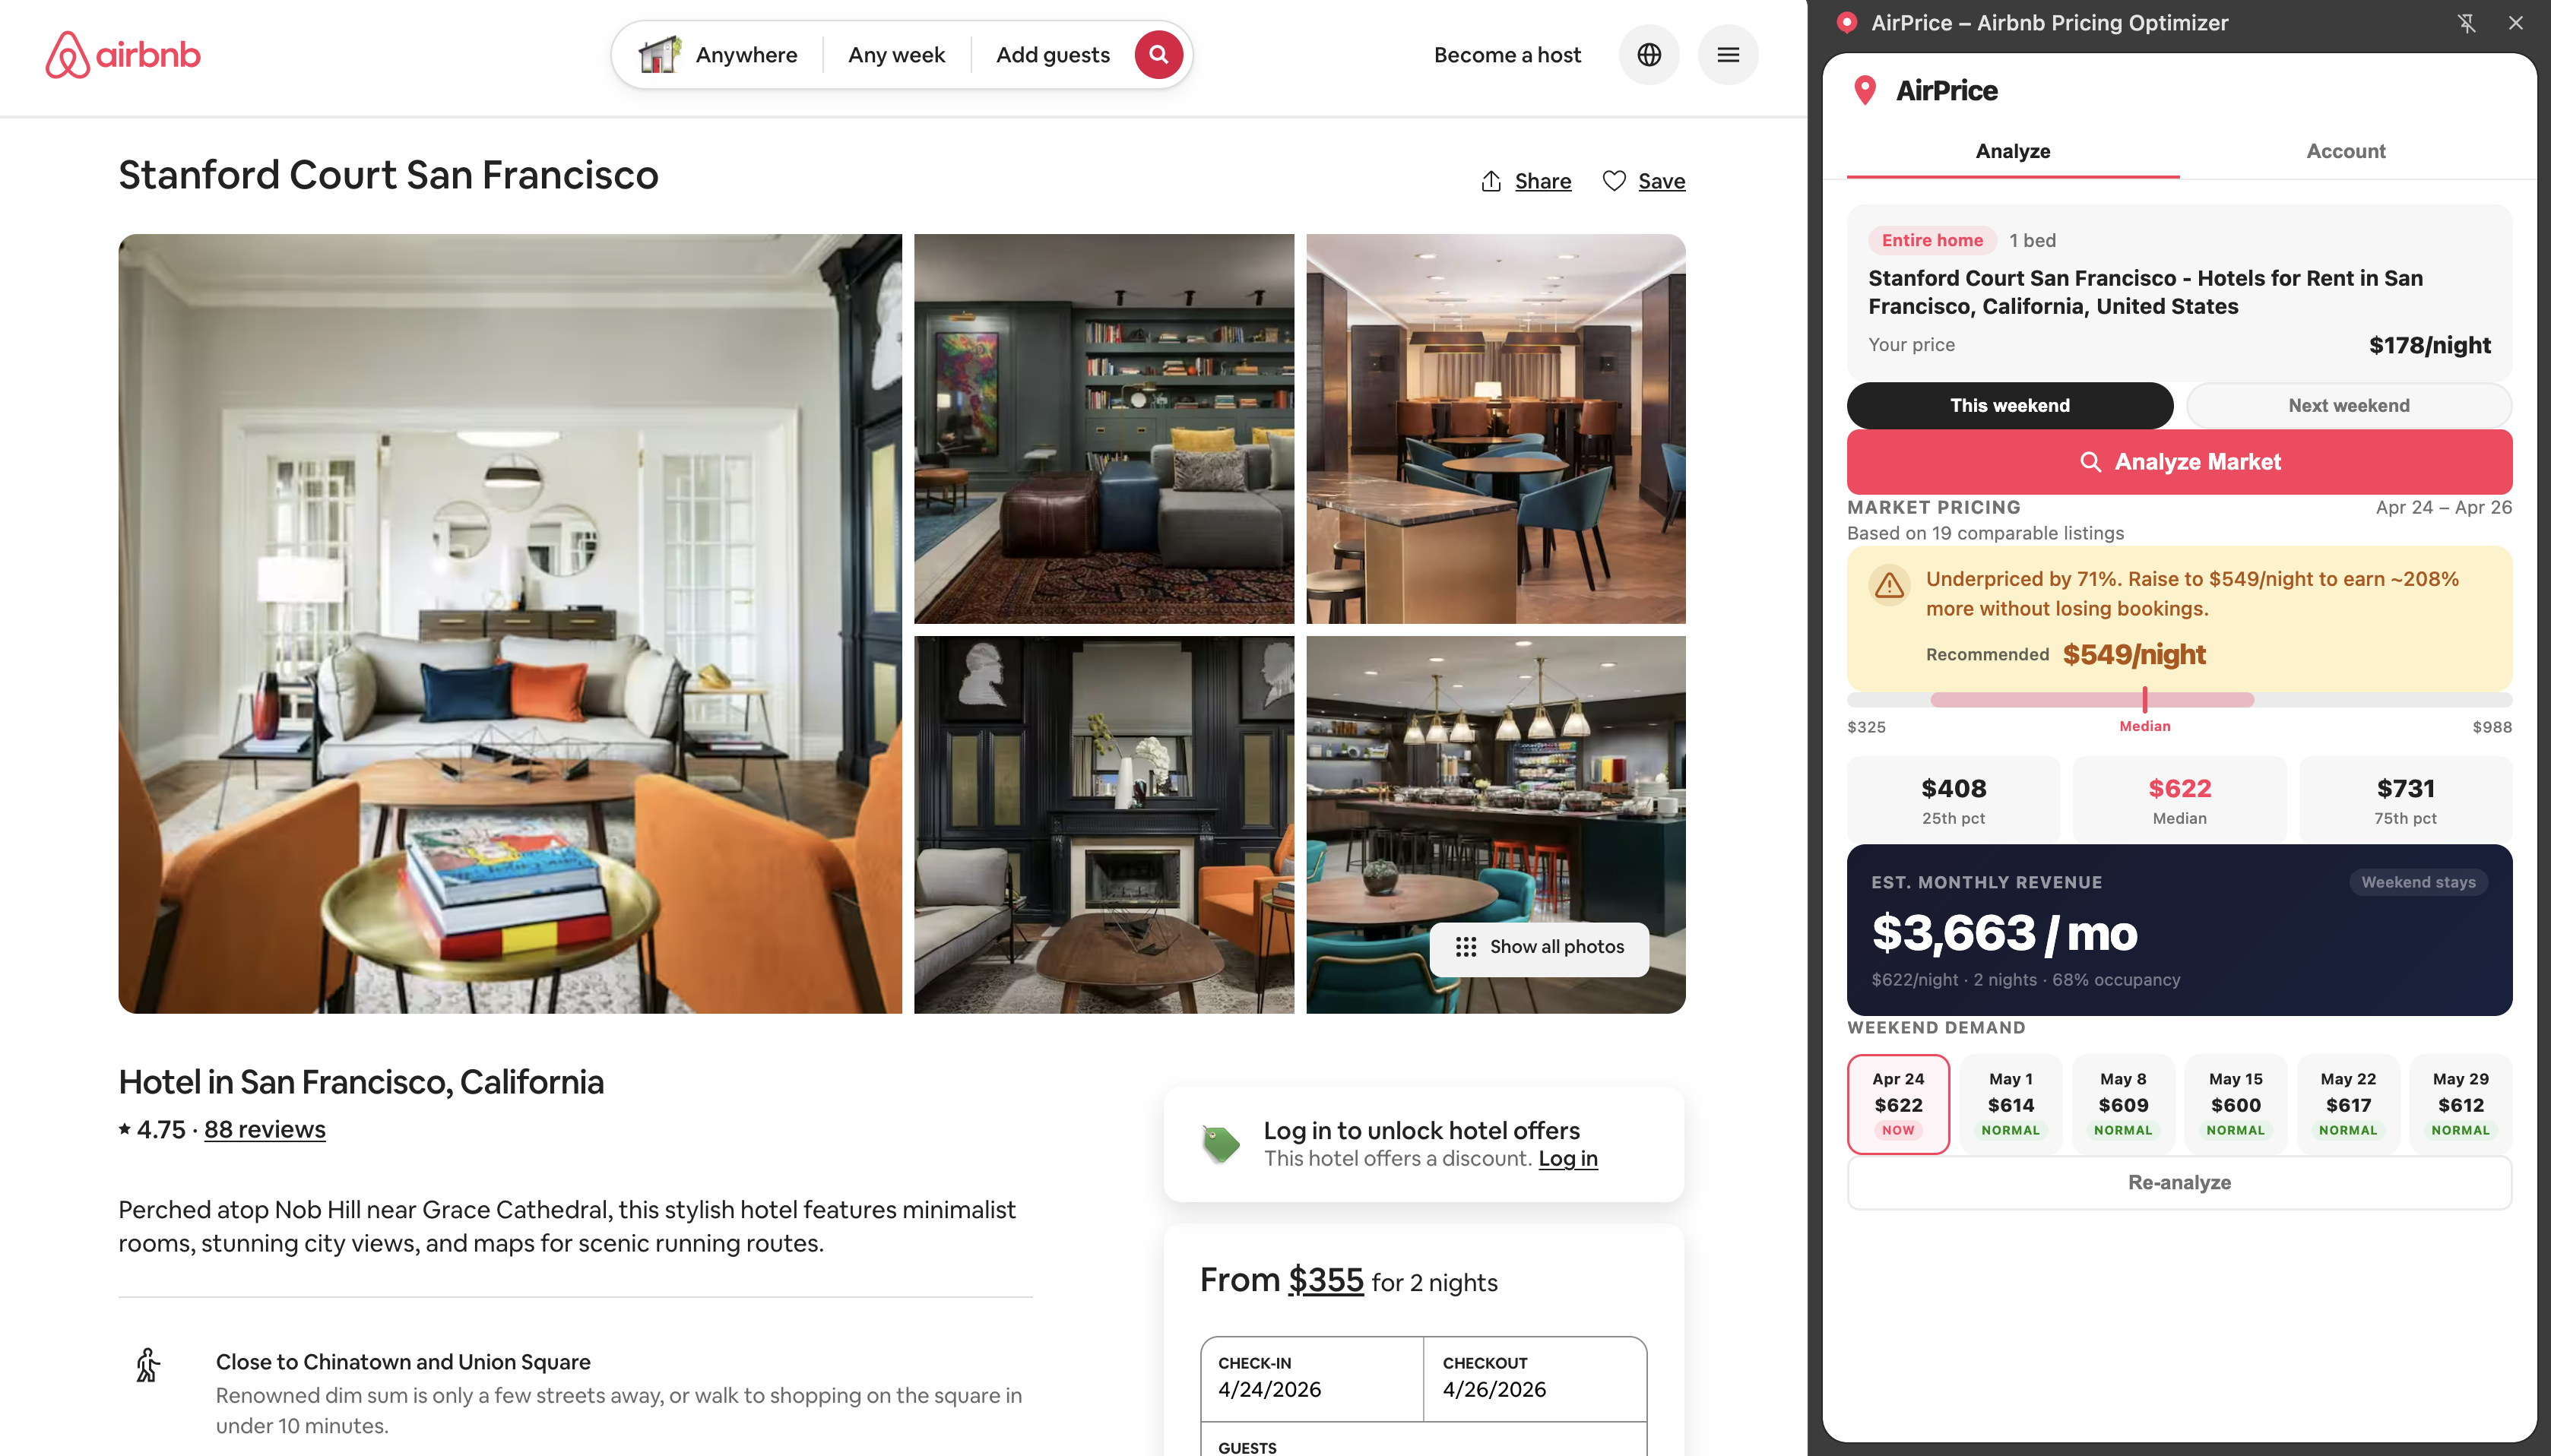
AirPrice pulls live pricing data from Airbnb search results for your city, bedroom count, and property type. Every time you analyze a listing, you see:
- P25, P50, P75 — the actual spread of what comparable listings charge this weekend
- Sweet spot price — the P45 of your comp set, which maximizes the rate × occupancy product
- 6-weekend demand calendar — median prices for the next 6 weekends so you can see demand trends
- Revenue calculator — plug in your nightly rate, occupancy estimate, and cleaning fee to model monthly income before committing to a price change
- Weekday vs. weekend split — the exact rate difference between Mon–Wed and Fri–Sun in your market
Step 1: Run a baseline analysis
Open your Airbnb listing page. Click the AirPrice icon to open the side panel. Hit "Analyze Market." Within seconds you'll see exactly where you stand against local comps — overpriced, underpriced, or in the sweet spot.
Step 2: Model the revenue impact
Use the Revenue Calculator in AirPrice. Slide the nightly rate to the market sweet spot, adjust your occupancy estimate, and add your cleaning fee. The calculator shows your projected monthly income in real time so you can see exactly what a $20 rate change is worth per month.
Step 3: Check the demand calendar
The 6-weekend demand calendar shows which upcoming weekends are "Hot" (above-median demand), "Normal," or "Soft." Hot weekends are your opportunity to charge 15–30% above your base. Soft weekends call for a rate reduction to protect occupancy.
Step 4: Re-analyze monthly
Markets shift. The comp set that existed in March may be very different in June. Run a fresh analysis at the start of each month to recalibrate your base rate against current market conditions. It takes 30 seconds and can add hundreds of dollars per month.
The hosts who consistently outperform their local comp set aren't luckier or better at hosting. They're more informed. They know what the market is paying right now — not what it was paying 6 months ago when they first set their rates.
Revenue optimization is fundamentally an information problem. AirPrice solves it. Use it every time you open a listing, and treat pricing as a monthly discipline rather than a one-time setup task.
For more on specific pricing frameworks, see our guides on Airbnb dynamic pricing strategy and how to set your base rate using real market data.