The single biggest mistake Airbnb hosts make is setting a rate once and leaving it alone. Markets fluctuate dramatically across the calendar year. A host charging $160/night every month of the year is either severely underpricing July or badly overpricing February — and often both at once.
Seasonal pricing isn't about being clever. It's about matching your price to market demand. When demand is high, you charge more. When demand softens, you reduce the price just enough to keep occupancy healthy. Done right, this can add $4,000–$12,000 to your annual revenue without adding a single booking or improving your listing in any way.
Why Seasonal Pricing Is Non-Negotiable
Here's the economic reality: Airbnb guests are price-sensitive in off-peak months and relatively price-insensitive in peak months. A traveler booking a beach house for July 4th weekend will pay what the market charges — they have no alternative. A traveler booking a February midweek stay has many alternatives and high elasticity.
Static pricing fails in both directions. It costs you occupancy in peak (because the market moved up and you didn't), and it costs you bookings in off-peak (because the market moved down and you didn't). The result: revenue that's a fraction of what seasonally-informed pricing delivers.
The scale of the opportunity: AirDNA's 2025 host study found that hosts who actively adjust rates seasonally earn 31% more annual revenue on average than hosts with static pricing — even controlling for market, property type, and review score. That's not optimization at the margins. That's a material income difference.
The rest of this guide gives you the specific actions, multipliers, and timing to capture that gap.
The Three Airbnb Seasons: Multipliers Explained
Most markets have three distinct demand bands. Understanding which band you're in at any given time tells you how to adjust your base rate.
Base Rate = your annual average target rate
Peak multiplier: 1.30 – 1.50 (30–50% above base)
Shoulder multiplier: 1.10 – 1.25 (10–25% above base)
Off-peak multiplier: 0.80 – 0.90 (10–20% below base)
Example: $140 base × 1.40 peak = $196/night in peak
These multipliers represent the typical range across diverse Airbnb markets. Your specific market may differ — a ski chalet might apply a 1.60 multiplier in February that would be unthinkable for a suburban spare bedroom. The key is to calibrate your multipliers against live comp data, not industry averages.
| Season | Typical Months | Rate vs. Base | Min Stay | Booking Window |
|---|---|---|---|---|
| Peak | Jun–Aug, Dec 20–Jan 5 | +30–50% | 3–5 nights | 4–12 weeks ahead |
| Shoulder (Spring) | Mar–May | +10–25% | 2–3 nights | 2–6 weeks ahead |
| Shoulder (Fall) | Sep–Nov | Base to +15% | 2 nights | 1–4 weeks ahead |
| Off-Peak | Jan–Feb, Nov 1–19 | -10 to -20% | 1–2 nights | Days to 2 weeks |
Month-by-Month Rate Action Plan (Jan–Dec)
Here's exactly what to do with your rates each month. These actions assume a typical mixed-market listing (not a pure ski or beach destination — see the market types section for adjustments).
Action: Drop to off-peak rate (base × 0.80–0.85). Reduce minimum stay to 1–2 nights. Activate monthly discount (35–40%) to capture 28-day remote worker bookings. New Year's Day itself (Jan 1–2) often carries residual holiday rates — hold peak pricing through Jan 2 before stepping down.
Action: Maintain off-peak rate. Valentine's Day (Feb 13–15) is a genuine spike event in romantic-destination markets — raise rates 20–30% for that 3-day window. Super Bowl weekend creates demand in host cities and flight-path cities. Check if your market has a local event (Mardi Gras for New Orleans, NBA All-Star for host city) and price accordingly.
Action: Transition to spring shoulder rate (base × 1.10). Spring break (mid-March through early April) is a hard peak in beach, mountain, and theme park markets — push rates to 1.35–1.45 for those weeks. Set your spring rates by early February so you're capturing advance bookers before comps fill up.
Action: Hold shoulder rate. Easter weekend (date varies: April 5 in 2026) spikes demand in family travel markets. Raise rates 15–25% for the long Easter weekend. College graduation season begins late April — if you're near a university, start raising rates for May graduation weekends now.
Action: Transition to peak rates by Memorial Day. May is the critical ramp month — raise rates 10% at the start of May, then another 15–20% by May 15 ahead of Memorial Day weekend. Memorial Day (May 25, 2026) is one of the highest-demand weekends of the year: set rates at 1.40–1.50 for May 22–26. Raise your 3-night minimum for Memorial Day.
Action: Full peak rate (base × 1.35–1.45). Set your 3-night minimum across the entire month. June is when most hosts have their best occupancy of the year — don't undercut the market. Check AirPrice weekly to ensure you're tracking the median. Summer demand can build faster than expected and comps raise rates mid-month; don't get left behind.
Action: Peak+ rate (base × 1.45–1.55). July 4th (July 4, 2026 falls on a Saturday — extra strong) is the single highest-demand date for most US Airbnb markets. Set July 2–6 at base × 1.60–1.70 and enforce a 3-night minimum. July is typically the highest-revenue month of the year for coastal, mountain, and urban listings alike.
Action: Hold peak rates through Labor Day. August is strong across most markets but slightly softer than July — rates at base × 1.35–1.45 are appropriate. Labor Day weekend (Aug 29–Sep 1, 2026) closes out summer with another demand spike: push to base × 1.50–1.60 for the long weekend. After Labor Day, begin stepping down.
Action: Drop to fall shoulder rate (base × 1.00–1.15) immediately after Labor Day. September is often a sharp demand cliff. However, markets with fall foliage (Vermont, upstate NY, Smoky Mountains) see demand build through mid-October — hold rates higher if that applies to you. Reduce minimum stay to 2 nights to capture fall weekend travelers.
Action: Maintain fall shoulder. Halloween (Oct 31) creates demand in nightlife, urban, and event markets. Columbus Day weekend (Oct 12, 2026) is worth a 15–20% bump. Check your local events calendar — October is often heavy with festivals, homecoming weekends, and harvest events that spike specific weekends well above the monthly average.
Action: Early November is off-peak: drop to base × 0.85. Then Thanksgiving (Nov 27, 2026) drives a major spike — raise rates to base × 1.35–1.45 for Nov 25–30. Urban markets near family destinations see very strong Thanksgiving demand. The day after Thanksgiving through Sunday is often booked 8–10 weeks in advance, so set your Thanksgiving rates by September.
Action: Dec 1–19 is moderate (base × 1.05–1.15). Dec 20–31 is peak: push to base × 1.45–1.60. Christmas week (Dec 23–26) and New Year's Eve/Day (Dec 31–Jan 1) are the two highest-demand nights in urban and destination markets — raise those specific dates to base × 1.70–1.90. Enforce a 3-night minimum for the Dec 20–Jan 2 window.
Holiday Demand Spikes: What's Worth a Surge
Not all holidays are equal on Airbnb. Here's how the major US holidays rank by demand impact, with the typical rate multiplier they support above your seasonal base:
| Holiday / Event | 2026 Dates | Surge Multiplier | Market Type Most Affected |
|---|---|---|---|
| New Year's Eve | Dec 31, 2026 | +50–90% | Urban, nightlife destinations |
| July 4th (Saturday in 2026) | Jul 2–6 | +45–70% | Beach, outdoor, nationwide |
| Labor Day Weekend | Aug 29–Sep 1 | +40–60% | Beach, lakes, nationwide |
| Memorial Day Weekend | May 22–26 | +35–55% | Beach, nationwide |
| Thanksgiving Weekend | Nov 25–30 | +30–50% | Urban, family travel |
| Christmas Week | Dec 22–27 | +35–60% | Ski, mountain, family |
| Spring Break | Mar 14–Apr 4 | +30–50% | Beach, theme park, warm-weather |
| Local Music Festival | Varies | +40–80% | Immediate vicinity |
| Valentine's Day | Feb 13–15 | +20–35% | Romantic destinations |
| Columbus Day Weekend | Oct 11–13 | +15–25% | Foliage, outdoor markets |
Local events often outperform national holidays. A listing two blocks from a 50,000-person music festival can charge 3–4× its normal rate for that weekend — more than any national holiday. Build a local events calendar and monitor platforms like Eventbrite and your city's tourism website for upcoming events that drive accommodation demand.
Adjusting Minimum Stay by Season
Minimum stay requirements are a pricing lever that most hosts set once and forget. But a poorly configured minimum stay can cost you significant revenue in both directions.
Peak season: 3–5 nights
A 2-night Friday–Saturday booking during peak summer blocks the surrounding weekdays, preventing a profitable 5–7 night family booking. During peak season when demand is high, set a 3–4 night minimum. This reduces booking count but often increases revenue because you capture longer, higher-value stays rather than short weekend trips.
Shoulder season: 2 nights
Shoulder season is predominantly weekend travelers who want Friday–Sunday or Saturday–Monday. A 2-night minimum captures this demand while preventing single-night stays that require a full turnover for minimal revenue. Avoid 3-night minimums in shoulder season — they price out the core demand segment.
Off-peak: 1–2 nights, 28+ night discount
Off-peak months call for flexibility. Set a 1-night minimum for short-notice bookings (within 7 days) so last-minute travelers can fill gaps. At the same time, activate a 30–40% monthly discount to attract longer-stay guests who need housing for 4–8 weeks. Long stays are your best off-peak strategy: fewer turnovers, stable income, lower guest acquisition cost.
Holiday windows: event-specific minimums
For specific holiday windows (July 4th, Thanksgiving, New Year's), set a minimum stay that matches the natural travel pattern. If July 4th falls on a Saturday (as in 2026), a 3-night minimum (Thu–Sun) captures the full holiday weekend without leaving adjacent nights orphaned. Mismatched minimums during holiday windows are one of the most common and costly seasonal errors.
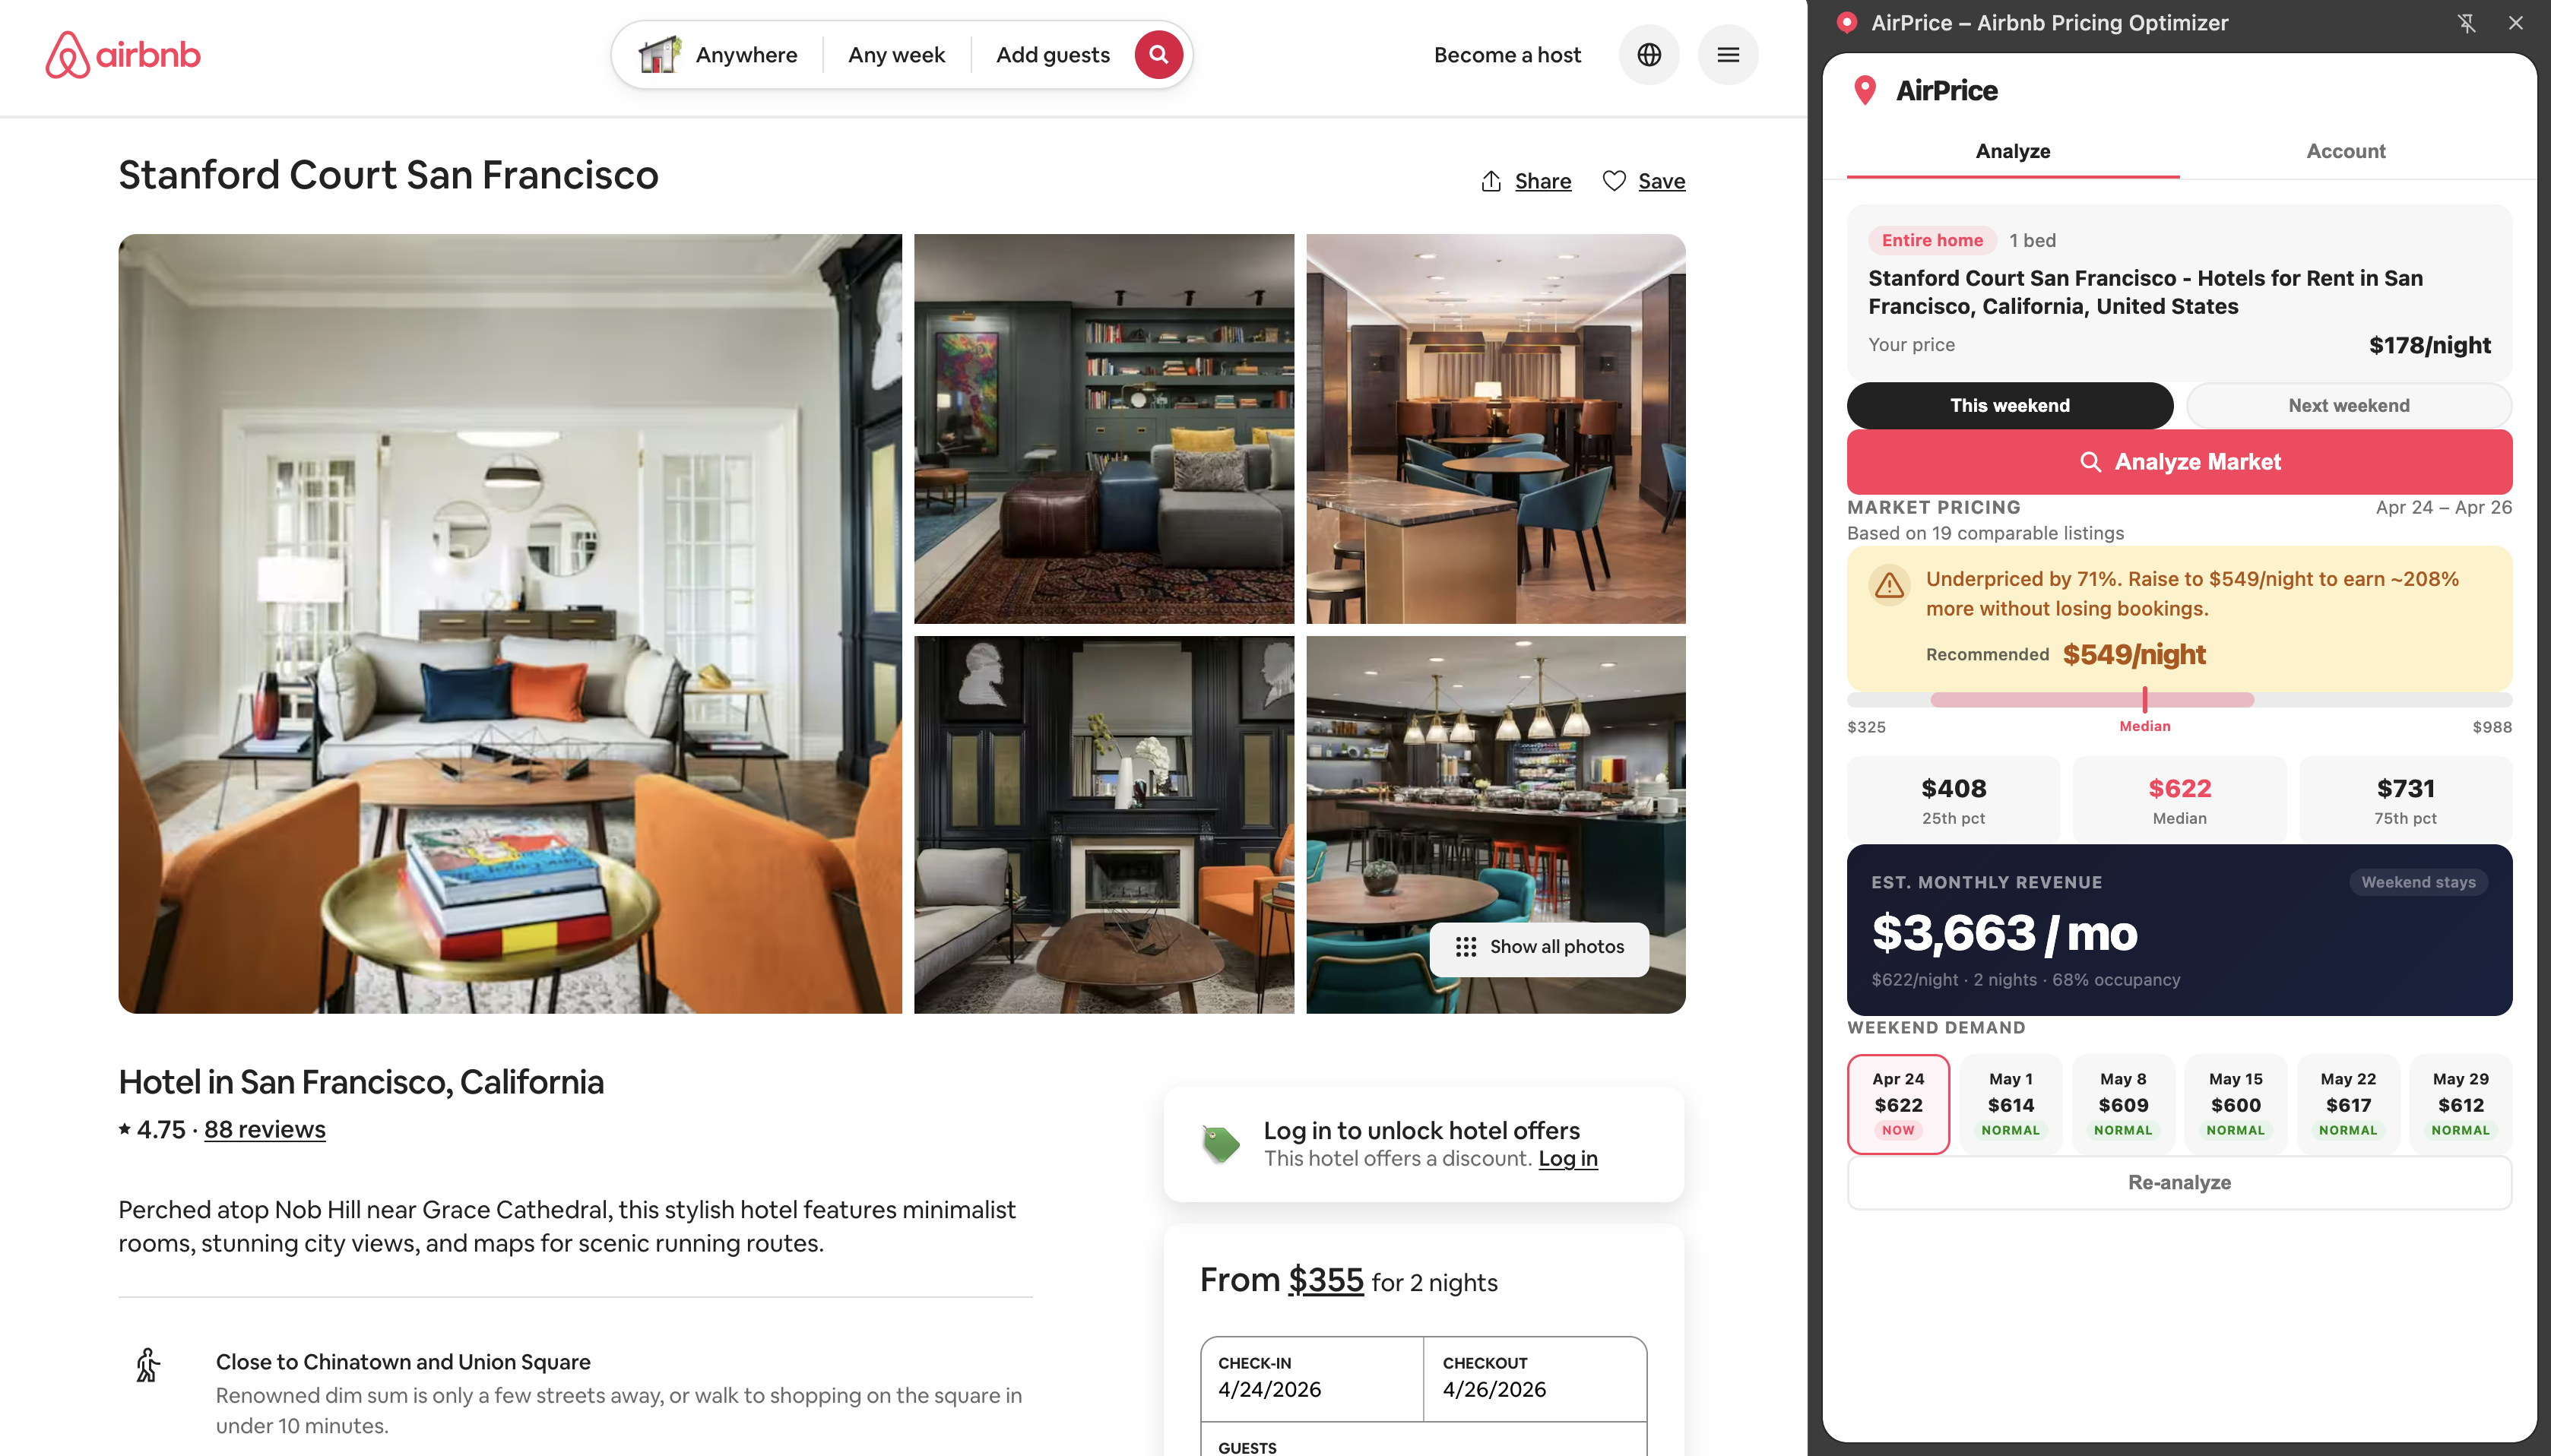
Reading the 6-Weekend Demand Calendar
The biggest challenge with seasonal pricing is knowing when a "shoulder" weekend is actually trending hot — or when a "peak" weekend has softened due to reduced travel demand. Generic seasonal multipliers can only take you so far.
AirPrice's 6-weekend demand calendar shows you the live median price for the next 6 Fri–Sun windows in your market. Each weekend is tagged as Hot, Normal, or Soft based on where the median sits relative to the trailing 6-week average.
Identify Hot weekends immediately
A Hot tag means the market median is running at least 15% above the recent average. This signals active demand — flights and accommodations are filling. If you're priced below median on a Hot weekend, raise your rate toward the sweet spot immediately. Don't wait. Demand windows close fast.
Don't panic-cut on Soft weekends
A Soft tag means the median is below the recent average. But check the comp count first: if fewer comps appear in the search results, it may mean comps have already booked out (bullish) rather than that demand is weak. AirPrice shows the comp count alongside the median so you can read the signal correctly.
Use the trend direction for rate decisions
AirPrice's trend analysis compares last weekend's median vs. the current weekend's median. If the market is trending up week-over-week, your seasonal demand window is building and you should hold or raise rates. If it's trending down, demand is fading and a slight rate reduction may be warranted to protect occupancy.
How Seasonal Patterns Differ by Market Type
The month-by-month calendar above describes a typical mixed market. But seasonal patterns shift significantly based on market type:
| Market Type | Top Peak Months | Weakest Months | Key Adjustment |
|---|---|---|---|
| Beach / Coastal | Jun–Aug (+50%), Memorial & Labor Day | Nov–Feb | Maximize summer minimum stay (5+ nights), aggressive off-season discounts |
| Ski / Mountain | Dec–Mar (+45%), Feb school break | Apr–May, Oct | Holiday week minimum 4+ nights; spring mud-season needs deep discounts |
| Urban / City | Apr–Oct evenly (+20–35%), NYE spike | Jan–Feb | Event-based pricing matters most; follow concert/conference calendar |
| Outdoor / Lake | Jun–Aug (+45%), Fall foliage | Nov–Mar | Fall foliage weekends can rival summer rates; don't drop too early |
| Warm Sun Belt | Jan–Mar (snowbirds +30%) | Jun–Sep (heat) | Inverted season: raise winter rates, discount summers heavily |
Sun Belt inversion: Markets like Phoenix, Scottsdale, Palm Springs, and parts of Florida have inverted seasonal patterns — snowbird demand peaks in January–March, while summer heat drives occupancy below 50%. If you're in a Sun Belt market, the month-by-month calendar above is largely reversed. Always calibrate against your local comp data.
The Monthly Rate Review Routine
Seasonal pricing isn't a set-and-forget task. Markets shift, events emerge, and comps change their strategies. The hosts who consistently outperform their local market run a simple monthly rate review.
First week of every month: analyze your market
Open your Airbnb listing with AirPrice active. Run a fresh analysis to see the current P25/median/P75 for your comp set. Has the median moved since last month? Are there more or fewer comps in your area? This 3-minute check tells you whether to hold, raise, or reduce your base rate.
Check the 6-weekend demand calendar
Review which of the next 6 weekends are Hot or Soft. For any Hot weekend where your calendar is still open, verify your rate is at or above the market sweet spot. For Soft weekends where you're not yet booked, consider a modest discount to stay competitive.
Audit the next 8 weeks for events and holidays
Check your local events calendar for anything in the next 8 weeks that drives accommodation demand: festivals, graduations, conferences, sporting events. For any event date where you're open, verify your rates reflect the event premium. Add any new events to your calendar for future months.
Confirm minimum stay settings match the season
As you move from season to season, update your minimum stay settings in Airbnb's calendar tool. This is one of the most overlooked adjustments — hosts who set 3-night minimums in peak and forget to lower them in shoulder season lose significant short-trip bookings that would have filled their calendar.
Seasonal pricing is the highest-leverage pricing strategy available to Airbnb hosts. It requires no investment in your property, no improvement to your listing, and no change to your guest experience. It just requires knowing when to charge more — and when to be competitive.
For more on how to structure your rates within each season, see our guide on Airbnb revenue optimization and Airbnb dynamic pricing strategy.