Low occupancy is the most common Airbnb problem hosts describe — and the most frequently misdiagnosed. Most hosts assume low occupancy means poor demand for their area. In reality, 80% of low-occupancy cases are self-inflicted: bad pricing, overly restrictive minimum stays, or a listing that doesn't convert browsers into bookers.
This guide walks through every cause of low occupancy, how to identify which one (or which combination) is affecting your listing, and what to do about each one.
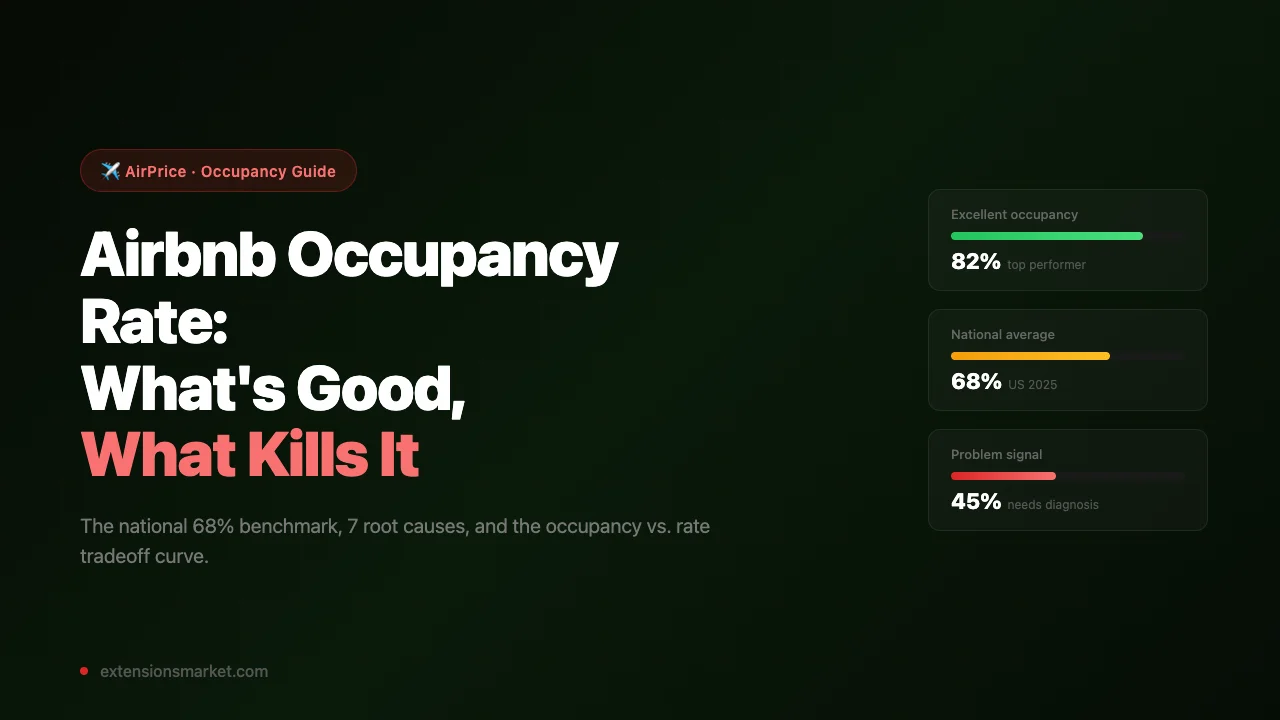
Occupancy Benchmarks: What's Good by Market
Before diagnosing a problem, you need to know whether you actually have one. Here's how occupancy benchmarks break down by market tier and property type:
| Market / Property Type | Excellent | Good | Below Average | Problem |
|---|---|---|---|---|
| Top 10 US markets (annual) | >80% | 70–80% | 55–70% | <55% |
| Secondary cities (annual) | >75% | 65–75% | 50–65% | <50% |
| Tertiary / suburban | >70% | 60–70% | 45–60% | <45% |
| Beach destination (seasonal) | >90% peak | 75–90% peak | 60–75% peak | <60% peak |
| New listing (first 3 months) | >65% | 50–65% | 35–50% | <35% |
National context: The US Airbnb market average occupancy was approximately 68% in 2025, down from a pandemic-era peak of 72% as supply expanded. An occupancy rate near 68% means you're performing in line with the broad market. The goal isn't to be average — it's to understand where you are so you can diagnose and improve.
Important caveat: compare yourself to your local comp set, not national averages. A listing in a high-supply market doing 60% occupancy might be outperforming its comps. A listing in a tight market doing 60% is probably underperforming. AirPrice's comp analysis shows you exactly what nearby listings are achieving so you have the right reference point.
How to Calculate Your Occupancy Rate
Example: 22 booked nights ÷ 30 available nights × 100 = 73.3%
Note: "Available nights" means nights you had open for booking,
not total calendar nights. Blocked nights don't count against you.
Airbnb shows your occupancy data directly in your Host Dashboard under Performance. Track it monthly and compare month-over-month. A single bad month isn't a signal — a trend over 3+ months is.
Also calculate your rolling 90-day occupancy, which smooths out seasonal noise. If your rolling 90-day is trending down over consecutive quarters, that's the signal to start diagnosing.
The 7 Causes of Low Occupancy — and How to Diagnose Yours
Low Airbnb occupancy has a finite set of causes. Work through these in order — pricing is almost always the first place to look.
Fix: Lower your rate to within 5–10% of the market median. Once occupancy recovers to 65–70%, test incremental rate increases to find the revenue-maximizing equilibrium.
Fix: Reduce your minimum stay. For shoulder and off-peak months, a 2-night minimum is usually optimal. For peak season, 3 nights is appropriate. Use Airbnb's calendar-specific minimum stay tool to apply different rules by date range.
Fix: Hire an Airbnb photographer. The cost ($150–$400) pays for itself within one or two additional bookings. If you do it yourself: natural light only, midday, wide-angle lens, staged and decluttered space. Reorder photos so the most impressive space leads.
Fix: Enable notifications on your phone. Set up Airbnb's automated response for initial inquiries. Respond to every message within 1–2 hours during reasonable hours. A 100% response rate and sub-1-hour average response time will improve your search visibility measurably over 60–90 days.
Fix: For low scores, identify the specific categories (cleanliness, accuracy, communication) where you're rated below 4.8 and address the root cause. For new listings, Airbnb's New Listing Boost gives elevated placement for the first 3 months — use that window to get reviews by pricing slightly below market to drive initial bookings.
Fix: Audit your amenities list and add everything you actually have. Verify your property type is set correctly. Update your listing title to include searchable keywords guests use (e.g., "Near downtown," "free parking," "pet-friendly") — these appear in Airbnb's search text matching.
Fix: Enable Instant Book. Use Airbnb's guest requirements (verified ID, positive review history) to filter for trustworthy guests while still allowing immediate booking. The occupancy improvement from enabling Instant Book is one of the fastest wins available to hosts who currently have it off.
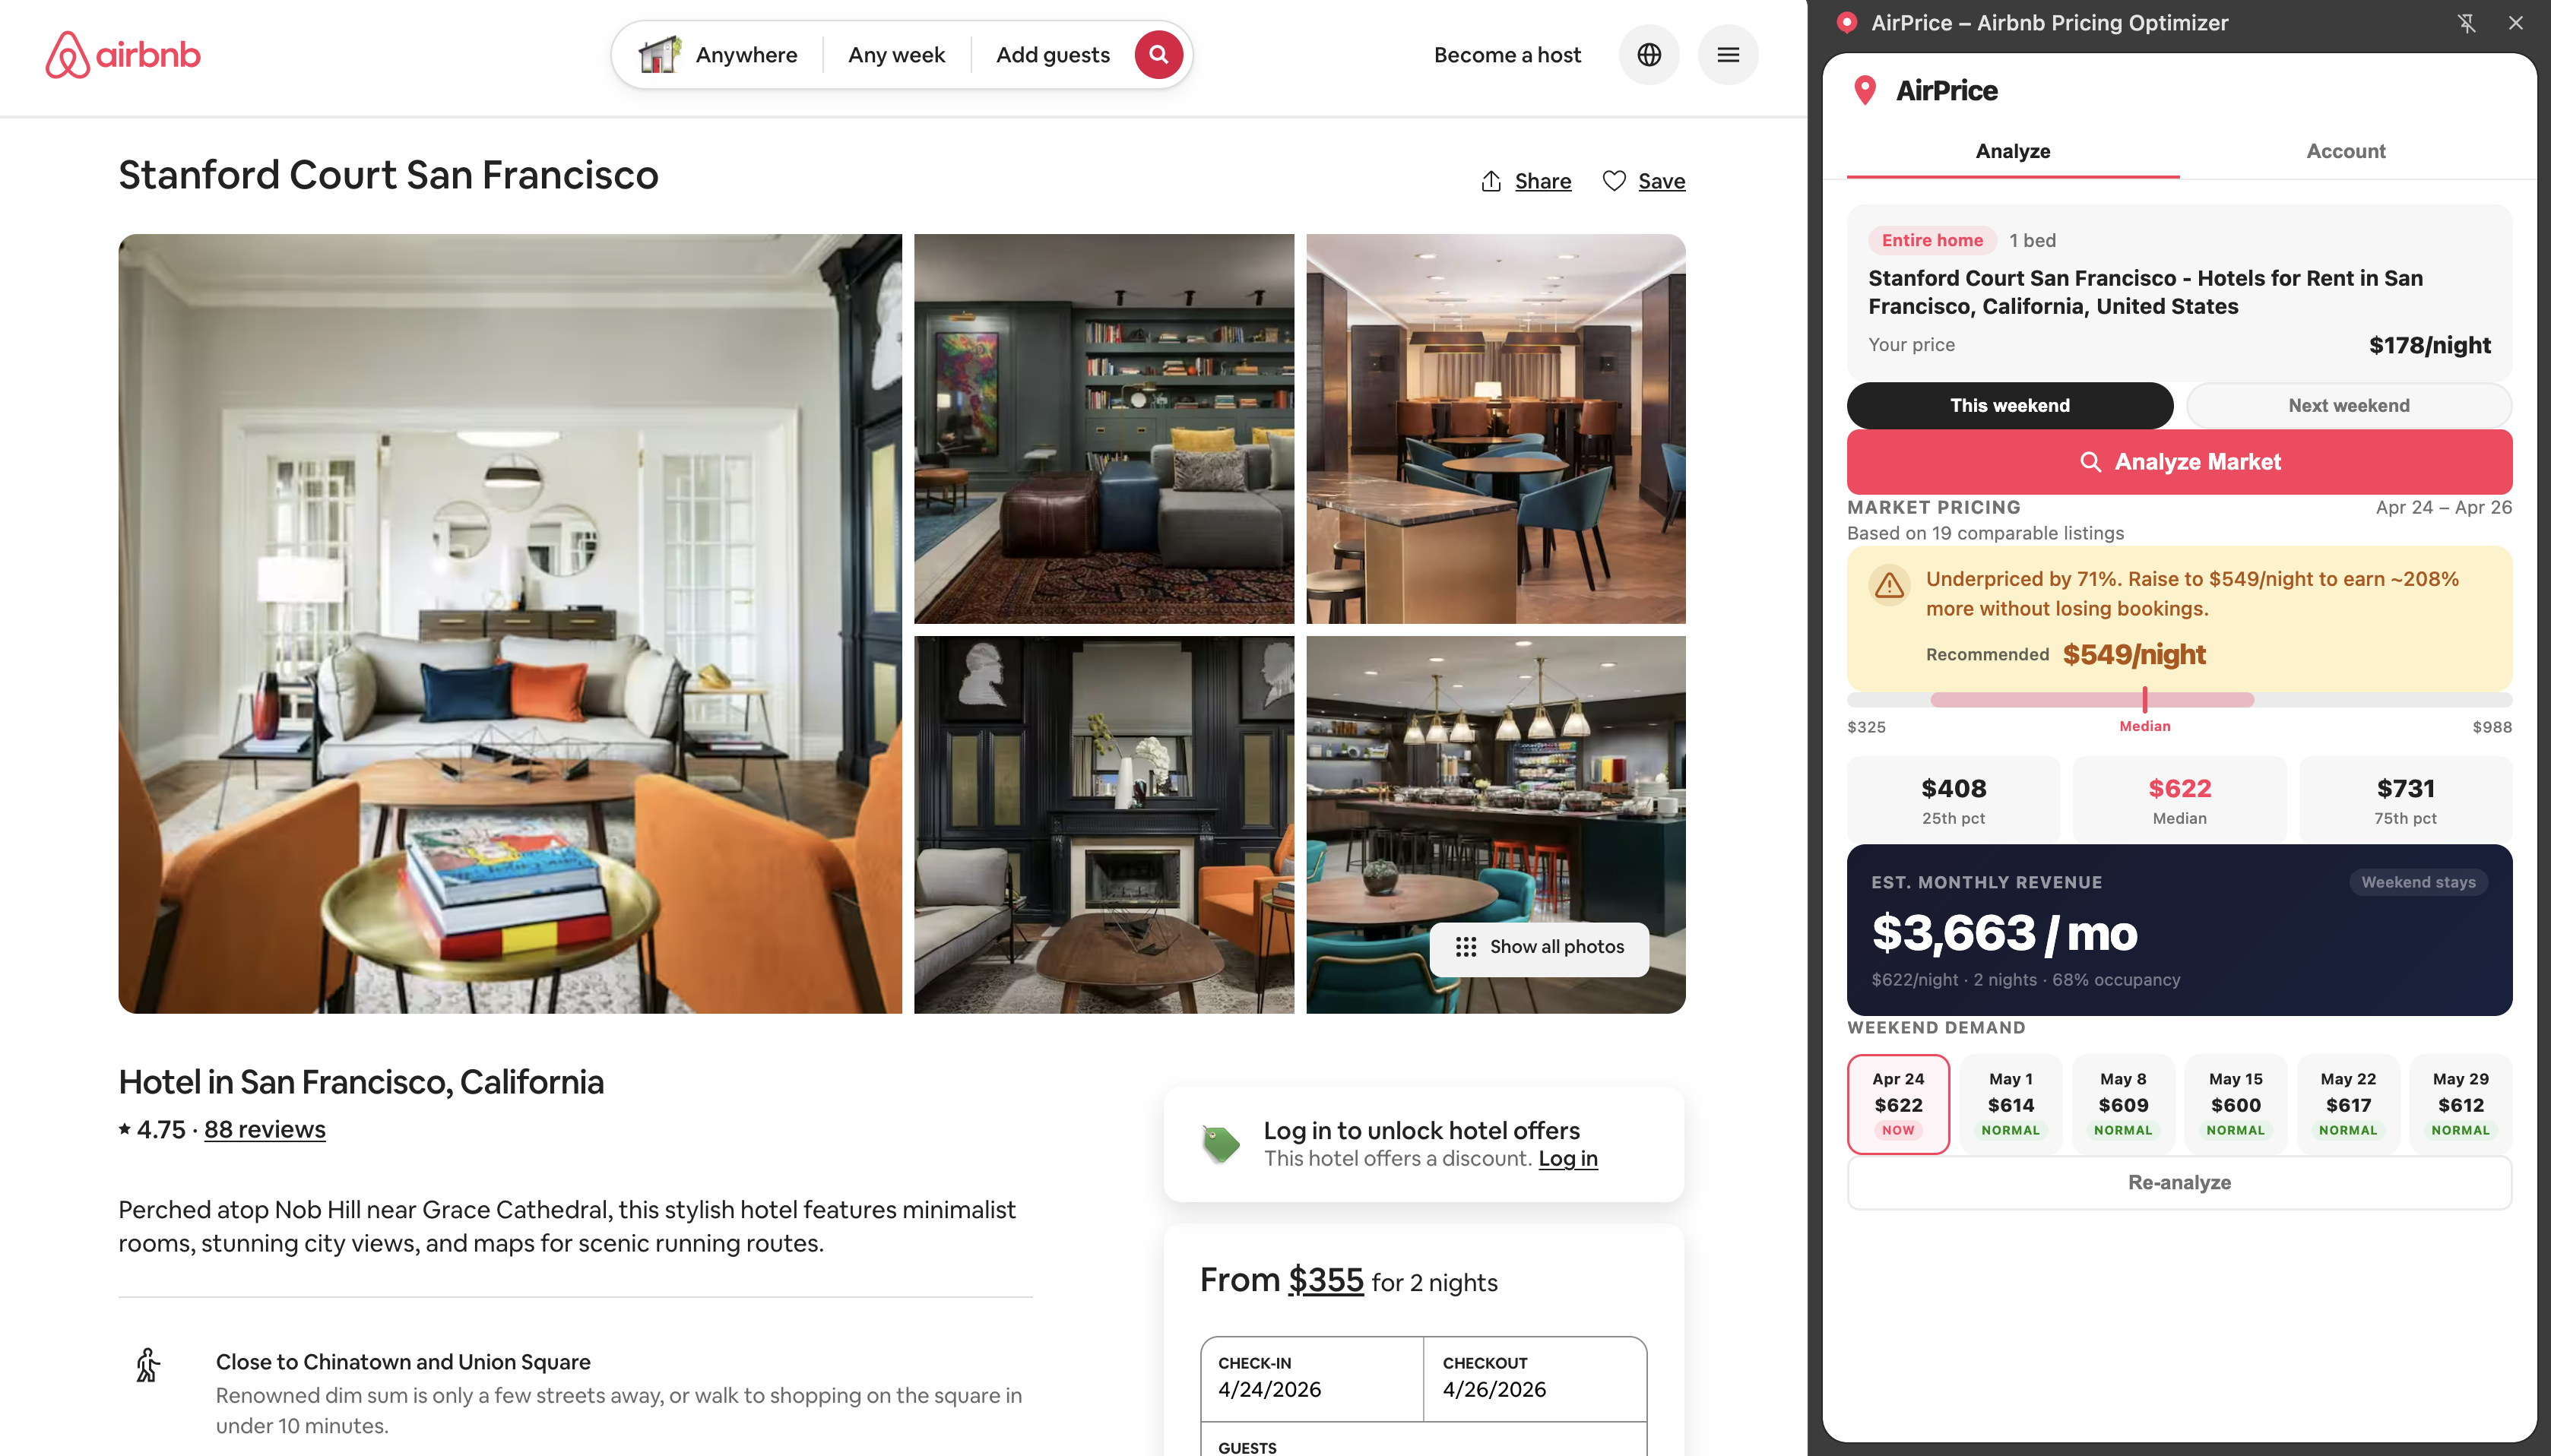
The Pricing Fix: Using Comp Data to Recalibrate
Pricing is the single most impactful occupancy lever. But simply "lowering your price" isn't the right frame. The goal is to find the price that maximizes your revenue — which means you need to know where the market actually sits before you make a change.
Run a live comp analysis with AirPrice
Open your listing on Airbnb and activate AirPrice. The analysis shows you the live P25, P50 (median), and P75 for listings matching your bedroom count and property type in your city. This is real-time market data, not historical estimates — it reflects what comparable listings are charging right now.
Identify where you sit in the distribution
If you're above P75 (the top 25% of the market), you're almost certainly overpriced relative to what the market will bear for a typical listing. If your reviews and amenities are below average for the comp set, even P50 pricing might be too high. If you're below P25, you're leaving money on the table (assuming you have good occupancy).
Move to the sweet spot price
AirPrice calculates a "sweet spot" price — the P45 of your comp set, which research shows maximizes the rate × occupancy product. Start by moving to the sweet spot. Give it 3–4 weeks and monitor occupancy. If occupancy improves to 70%+, you've found your market-clearing price. Then test small upward adjustments to find the revenue maximum.
Use the occupancy scores on comparables to understand the competitive landscape
AirPrice now shows estimated occupancy scores for each comparable listing: how booked they appear based on their price distance from median and their rating. High-rated comps priced near median show ~90% estimated occupancy. This tells you what the market can support — and where you need to be priced and rated to compete for that demand.
The Listing Quality Fix
Once pricing is calibrated, the next biggest occupancy driver is listing conversion — the percentage of guests who view your listing and then book it. A low conversion rate means your listing isn't convincing browsers to commit.
The elements that drive conversion, in order of impact:
- Cover photo — the single most important element. Guests click or skip based on this alone in search results. Every 100 guests who click your listing adds to conversion; every guest who scrolls past costs you a potential booking.
- Total price display — guests filter by total cost, not nightly rate. A competitive nightly rate with an outsized cleaning fee makes your listing look expensive on the search results page. Balance these.
- Review count and score — social proof. Listings with 20+ reviews at 4.8+ convert at roughly 2× the rate of listings with fewer than 5 reviews. Your first priority as a new host should be accumulating reviews.
- Listing title and description — secondary to photos, but important. Lead with what makes your listing unique: proximity to an attraction, a distinctive feature (rooftop deck, hot tub, mountain view). Don't waste the title on generic terms.
- Amenities completeness — guests filter by amenities. If you have WiFi, kitchen, washer, free parking — every one of those should be marked in your listing or guests with those filters will never see you.
The Occupancy vs. Rate Tradeoff Curve
One of the most important concepts in Airbnb optimization is understanding that occupancy and rate are not independent. As you raise your rate, occupancy typically falls. As you lower it, occupancy rises. The relationship isn't linear — it follows a curve with a revenue-maximizing point somewhere in the middle.
Rate $120 × 80% occ × 30 nights = $2,880/month RevPAN: $96
Rate $140 × 72% occ × 30 nights = $3,024/month RevPAN: $101
Rate $160 × 62% occ × 30 nights = $2,976/month RevPAN: $99
Rate $180 × 50% occ × 30 nights = $2,700/month RevPAN: $90
Peak: $140–$160 range — but the $140 sweet spot has the best occupancy stability
This example illustrates why obsessing over occupancy without considering rate is a mistake. Moving from 90% to 72% occupancy (by raising rate from $100 to $140) increases monthly revenue by $324 and reduces your cleaning and guest management burden by roughly 5 bookings per month.
The key insight: find your revenue-maximizing price, not your occupancy-maximizing price. These are almost never the same number, and the revenue-maximizing price is almost always higher.
Reading the Occupancy Score on Comparables
AirPrice v1.3.0 introduced occupancy scoring for each comparable listing. When you run an analysis, each comp in the results shows an estimated booking rate: "~88% booked," "~72% booked," etc. This score is based on two proxy signals:
- Rating score: Listings with 4.8+ ratings tend to show 85–90% occupancy in high-demand markets. Listings rated 4.5–4.7 show roughly 75–80%. Below 4.5 drops further.
- Price distance from median: The further a listing's price deviates from the market median, the larger the occupancy penalty. A listing priced 30% above median loses an estimated 15–20 points of occupancy relative to a median-priced comp with the same rating.
How to use it: Look at the comps with the highest estimated occupancy. What do they have in common? Are they clustered near the market median? Do they have higher ratings? This tells you the characteristics of the best-performing listings in your market — and gives you a roadmap for what to target.
The occupancy score isn't a real booking data pull (Airbnb doesn't expose that) — it's an inference from observable signals. Treat it as directional, not precise. A comp showing "~88% booked" might be 82% or 93% in reality. The ranking relative to other comps is more reliable than the absolute number.
The Occupancy Recovery Action Plan
If your occupancy is below your market's benchmark, here's the prioritized sequence of actions:
Week 1: Fix pricing (if applicable)
Run an AirPrice analysis to see where you sit relative to the market median. If you're above P60 for your comp set and occupancy is below 65%, lower your rate toward the sweet spot. This is the single highest-impact change you can make and the one with the fastest feedback loop.
Week 1–2: Fix minimum stay and Instant Book
Enable Instant Book if it's off. Audit your minimum stay and reduce it to 2 nights if you're currently at 3+ during non-peak months. These two changes alone can recover 10–15 percentage points of occupancy in markets where demand is available but your listing is blocking it with friction.
Month 1: Improve listing quality
If your cover photo is subpar, fix it. Audit your amenities list. Update your title to be more descriptive. These changes take effect immediately in Airbnb search but take weeks to show up in booking data, so start early.
Months 1–3: Improve response rate and review score
Improve your response rate to 95%+ by enabling notifications. For review score, review your recent guest feedback and fix the specific issues guests mention. If cleanliness is the category pulling you down, invest in a better cleaning service. If communication scores are low, set up automated check-in instructions and a day-before welcome message.
Month 3+: Monitor and optimize
Once occupancy has recovered, run a monthly rate review with AirPrice. Test small rate increases (5–10%) and measure the occupancy impact over 4-week windows. This iterative approach finds the exact revenue-maximizing price for your listing in your specific market conditions.
Low occupancy is almost always a solvable problem. The hosts who stay stuck are the ones who assume their market is just weak. In most cases, the market is fine — the listing is the bottleneck. Fix the listing, and the bookings follow.
For more on how pricing decisions connect to your total revenue, see the Airbnb revenue optimization guide and our breakdown of 9 proven strategies to increase Airbnb revenue.