The Store: Where They Started
A Shopify jewelry brand — handmade silver and gemstone pieces, $120–$280 average product price. Strong Instagram presence, consistent paid traffic from Facebook and Pinterest, and a 4.8-star product average from repeat customers who loved the quality. By all appearances, the ingredients for a successful store were in place.
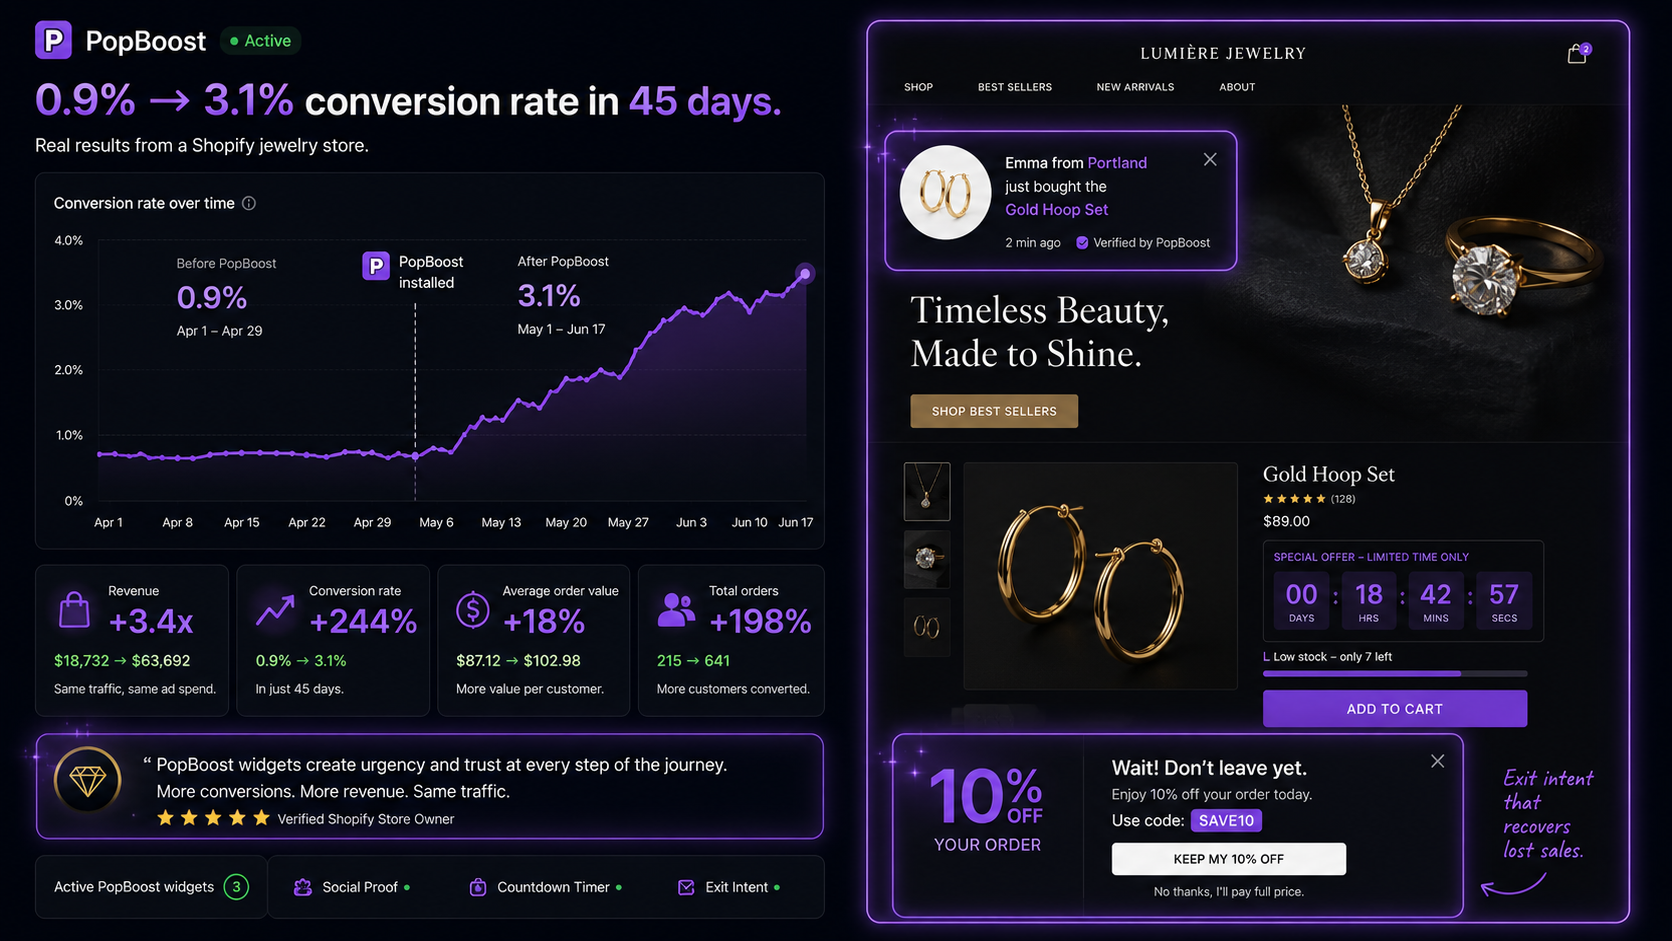
But conversion rate sat at 0.9% for months. At $3,800/month in ad spend driving roughly 4,200 monthly sessions, that translated to 38 orders per month at a $145 AOV — $5,510 in monthly revenue. The cost to acquire each customer was over $100. The economics worked only barely, and margins left almost nothing to reinvest.
The owner's instinct was that the traffic was wrong — wrong audience, wrong keywords, wrong creative. This is almost always the first hypothesis when conversion is low. It's also usually wrong.
| Metric | Before | After |
|---|---|---|
| Overall store CVR | 0.9% | 3.1% |
| Product page CVR | 1.2% | 4.4% |
| Cart abandonment rate | 78% | 61% |
| Average session duration | 1m 42s | 2m 58s |
| Revenue per visitor | $0.54 | $1.87 |
| Widget combination used | — | Social proof + countdown timer + exit intent |
The Diagnosis: What Was Killing Conversion
A 20-minute product page audit on a real mobile device in private browsing mode — seeing exactly what a first-time visitor sees — surfaced five problems immediately.
Before: the product page
- No visible reviews above the fold
- No social proof — no recent purchase activity
- Return policy linked only in footer
- No urgency signals
- Free shipping threshold ($75) visible only in cart
- No exit recovery — visitors left without a final offer
After: the product page
- Reviews pulled up to just below product title
- Social proof popup firing 5s after page load
- Return policy ("30-day free returns") on page
- Low-stock badge on limited-edition pieces
- Free shipping bar visible in header (sticky)
- Exit intent popup with 10% first-order offer
Every one of these gaps maps to a specific reason jewelry buyers don't convert. Jewelry is a high-consideration purchase: the price is non-trivial, the buyer can't touch the product, and the fear of "it doesn't look like the photos" is real. Trust signals aren't optional at this price point — they're the conversion mechanism.
The same 5 fixes work for any Shopify store
Social proof, exit recovery, free shipping bar, low-stock badges — all five PopBoost widgets. One install, under 10 minutes to configure.
Install PopBoost Free →The 5 Changes Made in Week 1
PopBoost social proof popup configured to show "Sarah from Portland bought the Moonstone Ring 4 hours ago" — pulling from real order history. Set to appear 5 seconds after page load, display for 5 seconds, and reappear every 45 seconds. Restricted to product pages only. This addressed the cold-brand trust problem head-on: if others are buying, it's safe to buy.
Added a "30-day free returns, no questions asked" line directly below the Add to Cart button — three lines of text, no new design work required. Jewelry buyers who hesitate often do so because of return anxiety: "What if it doesn't look right in person?" Making the return path visible and easy at the decision point directly removes that hesitation. This required zero apps — it was a theme content edit.
The store had a $75 free shipping threshold that 80% of orders naturally exceeded — but almost no visitors knew it existed before reaching the cart. A sticky free shipping bar using PopBoost's announcement bar widget ("Free shipping on orders over $75 — you're $X away") surfaced the threshold throughout the session, converted awareness into a motivation to add an item, and functioned as a persistent trust signal ("this is a real store with free shipping policies").
Configured PopBoost's exit intent to trigger on desktop cursor-exit and mobile rapid-scroll-back. Offer: "10% off your first order — use at checkout." This recovered a portion of visitors at the highest abandonment risk moment. In the first 30 days: 4.8% of exit intent triggers converted to a purchase. At 4,200 monthly sessions with ~60% triggering exit intent at some point, that's roughly 120 additional orders per month at the discounted price — still significantly profitable given the alternative was zero revenue from those visitors.
PopBoost low-stock badges configured to appear when inventory dropped below 5 units: "Only 3 left." This was applied only to genuinely limited pieces (one-of-a-kind designs and small-batch gemstone items). The restriction was deliberate — applying it to high-inventory core pieces would have felt manufactured. On limited-edition items, the low-stock signal is accurate, relevant, and matches the buyer's understanding of the product's nature.
Week-by-Week Metric Timeline
Sessions: 4,200 · Conversion rate: 0.9% · Orders: 38 · Revenue: $5,510
Sessions: 4,100 · Conversion rate: 1.4% · Orders: 57 · Revenue: $8,265 — immediate lift from social proof and return policy changes, which affect every session from day one
Sessions: 4,300 · Conversion rate: 2.1% · Orders: 90 · Revenue: $13,050 — exit intent data accumulating, low-stock badges driving urgency on bestsellers, free shipping bar improving cart completion
Sessions: 4,400 · Conversion rate: 3.1% · Orders: 136 · Revenue: $19,720 — compound effect of all signals working together; returning visitors already familiar with the brand converting at a higher rate
(baseline)
(day 45)
(same traffic)
(same ad spend)
Which Change Moved the Needle Most
Attributing conversion gains to individual changes in a live store is imprecise — every visitor session is affected by all changes simultaneously. That said, the week 1 data (before exit intent and low-stock badges had meaningful sample sizes) points clearly to two changes as the highest-leverage:
- Social proof popup: Conversion lifted from 0.9% to approximately 1.4% in week 1, before exit intent had any data. This suggests social proof — the cold-brand trust mechanism — was the largest single gap.
- Return policy on the product page: The second trust signal. Jewelry buyers need to know returns are easy before committing. Moving this from the footer to the product page required no app — just a content edit — and made an immediate difference.
Exit intent contributed meaningfully but took two weeks to show up in the data — it requires enough volume of exit events to generate statistically noticeable orders. Low-stock badges were the most targeted change: they only affect product pages where inventory is genuinely low, so their impact is localized but significant on those specific pages.
How to Run This Playbook on Your Store
Step 1: Do the mobile audit first (15 minutes)
Open your three best-selling product pages in a private browser on your actual phone. Scroll as a normal visitor would. Answer: Is a trust signal (social proof, reviews, or third-party validation) visible within 5 seconds? Is your return policy visible on the page, not just in the footer? These two questions identify the highest-leverage gaps instantly.
Step 2: Move the return policy immediately
This takes 10 minutes and costs nothing. Add three lines of text below your Add to Cart button: "30-day returns · Free shipping on $X+ · Made in [location]." The specificity matters — "30-day returns" converts better than "hassle-free returns" because it answers the question concretely.
Step 3: Install PopBoost and configure social proof + exit intent first
Start with the two highest-leverage widgets: social proof popup (on product pages, fires at 5 seconds, shows for 5 seconds) and exit intent (on all pages, triggers on exit, shows a first-order offer). These are your Week 1 changes — they affect every session from day one and require no ongoing management.
Step 4: Add the free shipping bar and low-stock badges in Week 2
The free shipping bar works best when 60%+ of your orders already exceed the threshold naturally — check your order data before setting the amount. Low-stock badges should be restricted to products with genuinely limited inventory — applying them to products that are never actually out of stock trains customers to ignore them.
Step 5: Measure at day 30, not day 7
Exit intent needs volume to show up. Social proof benefits compound as returning visitors see consistent signals across multiple sessions. The full effect of all five changes together takes 30–45 days to stabilize. Don't interpret week 1 data as the final answer.
Add all five conversion signals to your store today
Social proof, exit intent, free shipping bar, low-stock badges, and countdown timers — one PopBoost install, under 10 minutes to configure, free to start.
Install PopBoost Free on Shopify →Frequently Asked Questions

PopBoost ‑ FOMO & Popups
7 Shopify conversion widgets. One $19/month app.