Short-term rental investing involves two distinct research phases: finding a market that works, and analyzing a specific deal to decide whether to buy. Most real estate investment tools are built for one phase or the other — not both. Using the wrong tool at the wrong stage leads to either poor market selection or slow deal evaluation.
This guide breaks down the best tools for each phase of the STR investment process, what each one actually does well, and what it costs.
What STR Investors Actually Need from a Tool
Before evaluating any tool, it helps to be clear about what information you need and when. STR investment analysis typically follows three phases:
| Phase | Question You're Answering | Right Tool Type |
|---|---|---|
| Market Selection | Which city/neighborhood has strong STR demand and favorable regulations? | Market-level data (AirDNA, Mashvisor) |
| Deal Screening | Is this specific property financially viable as an STR at this price? | Deal analyzer (STRInvest, spreadsheet) |
| Due Diligence | Are the numbers reliable? Is STR legal here? What are the risks? | Regulation databases, county records, legal research |
Most investors get stuck spending too much time on Phase 1 and too little on Phases 2 and 3 — or vice versa. The right toolkit addresses all three efficiently.
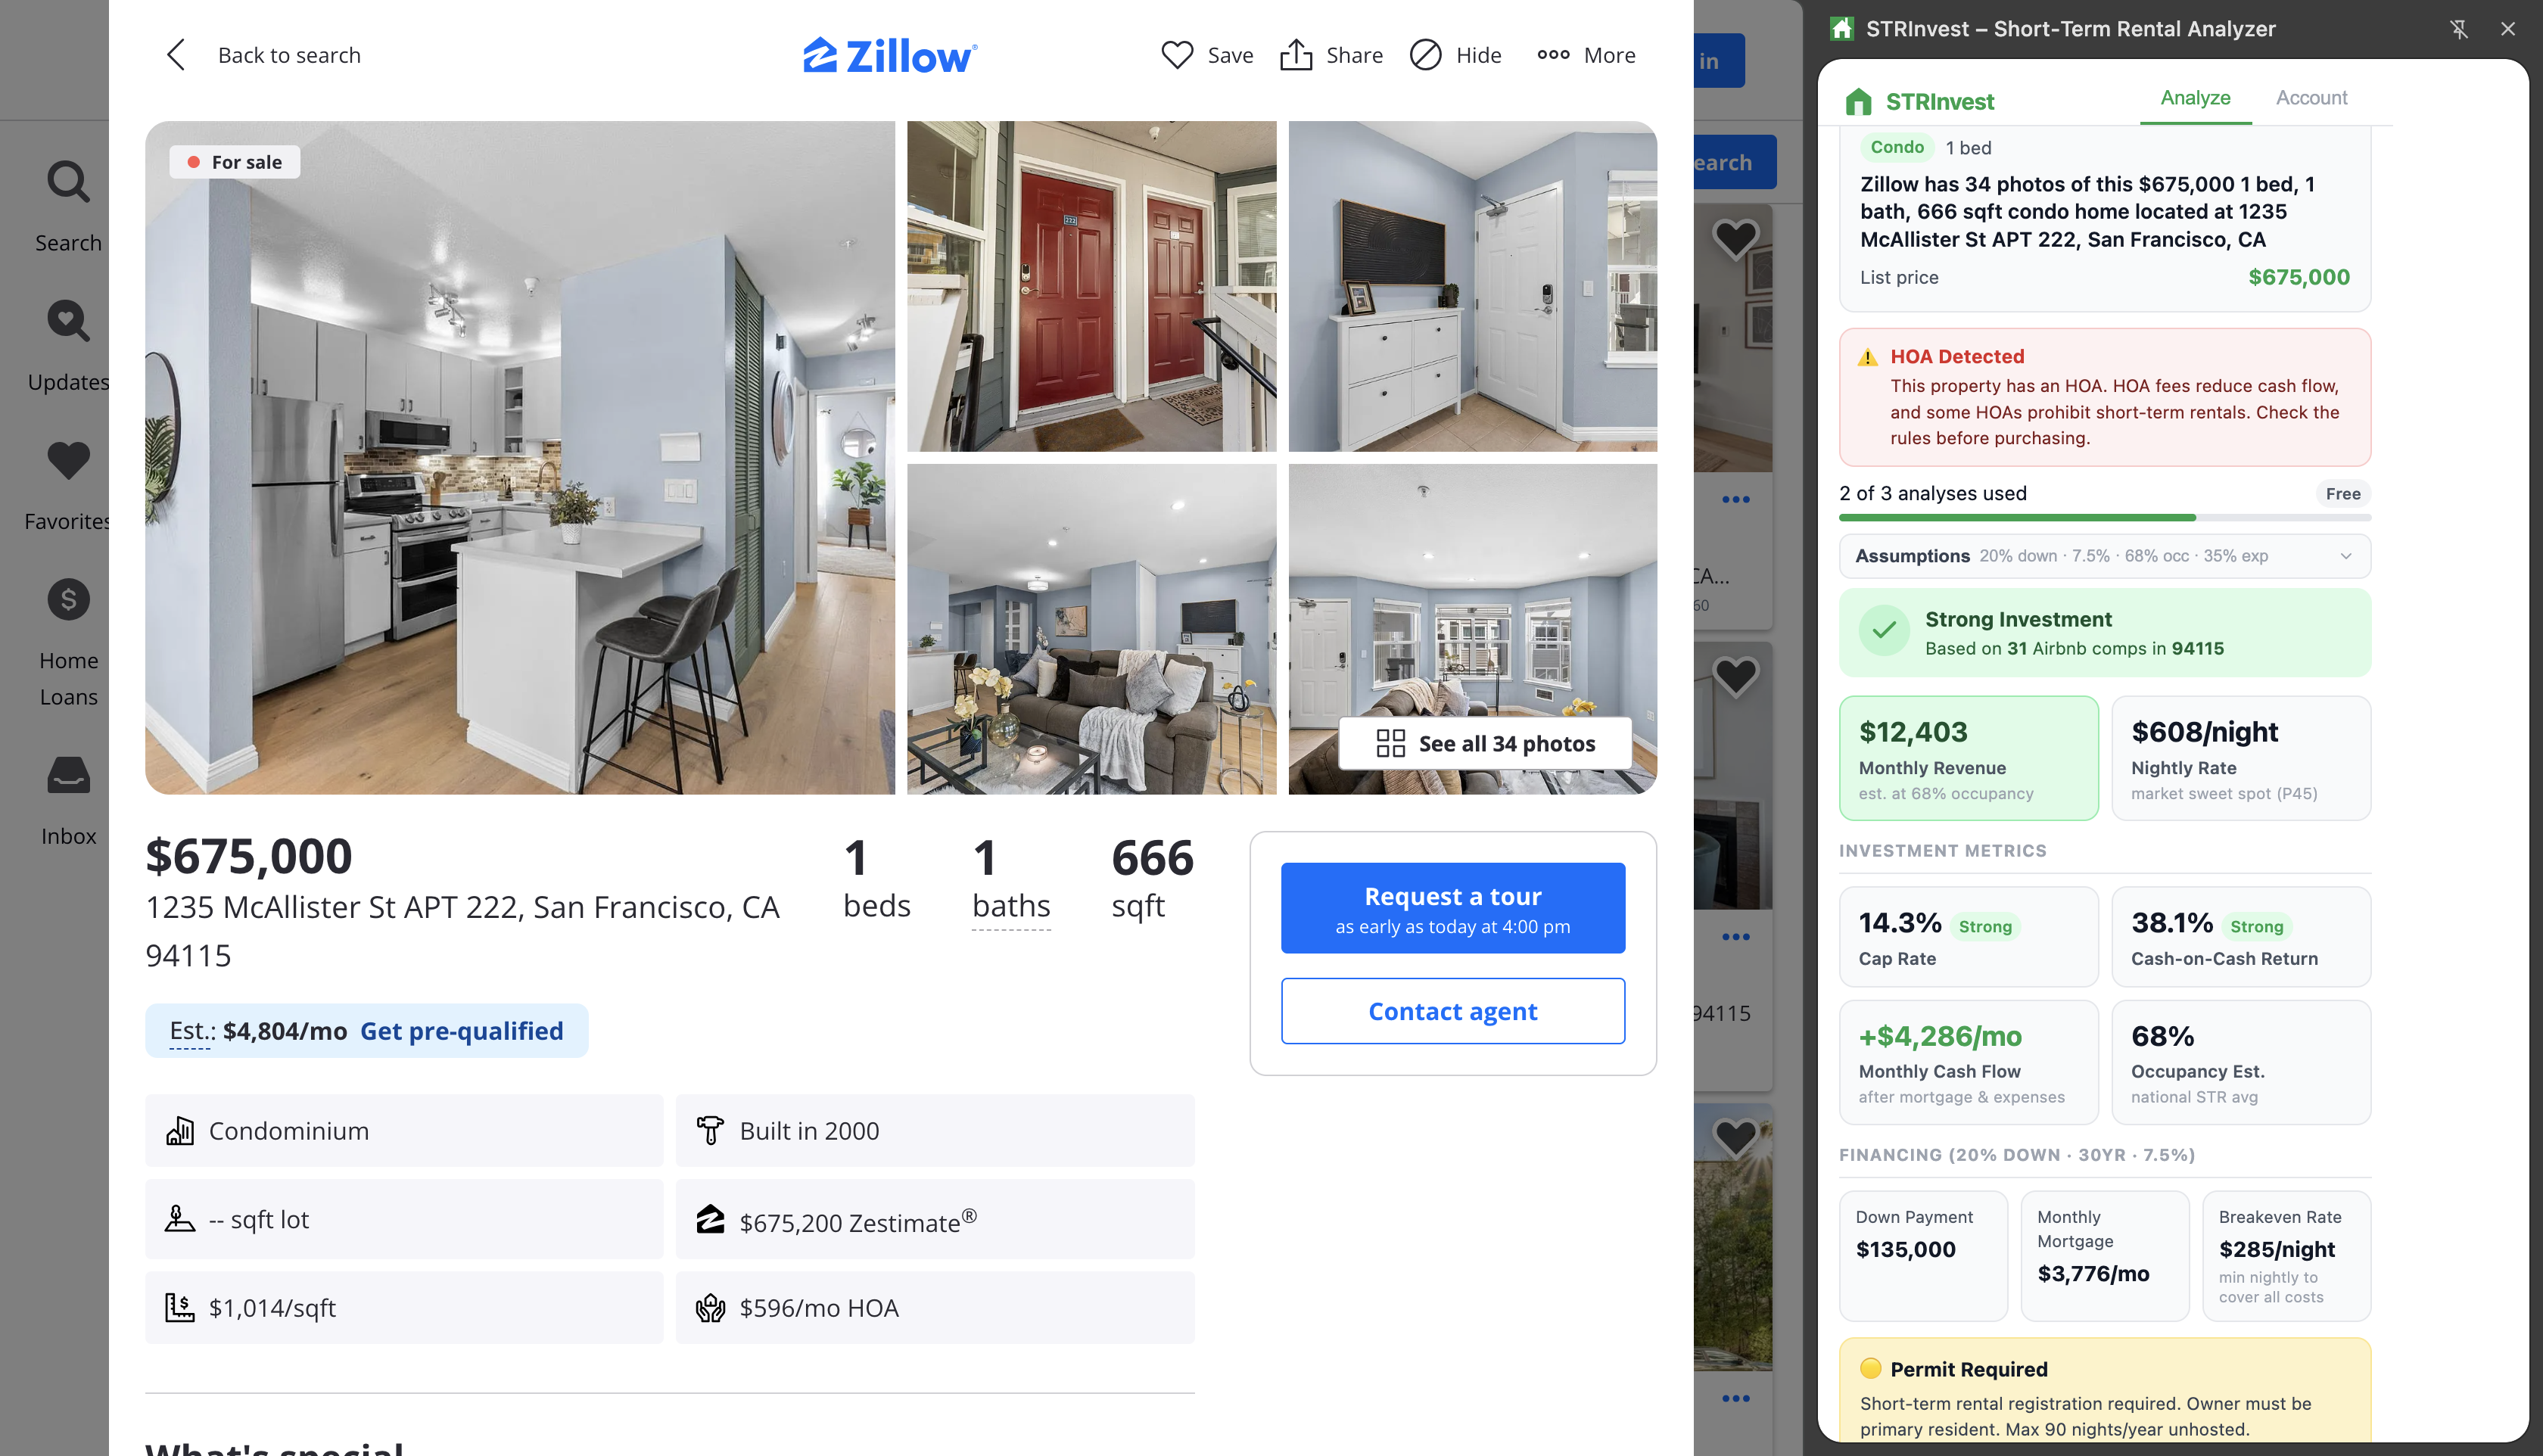
STRInvest — Deal Analysis on Any Zillow Listing
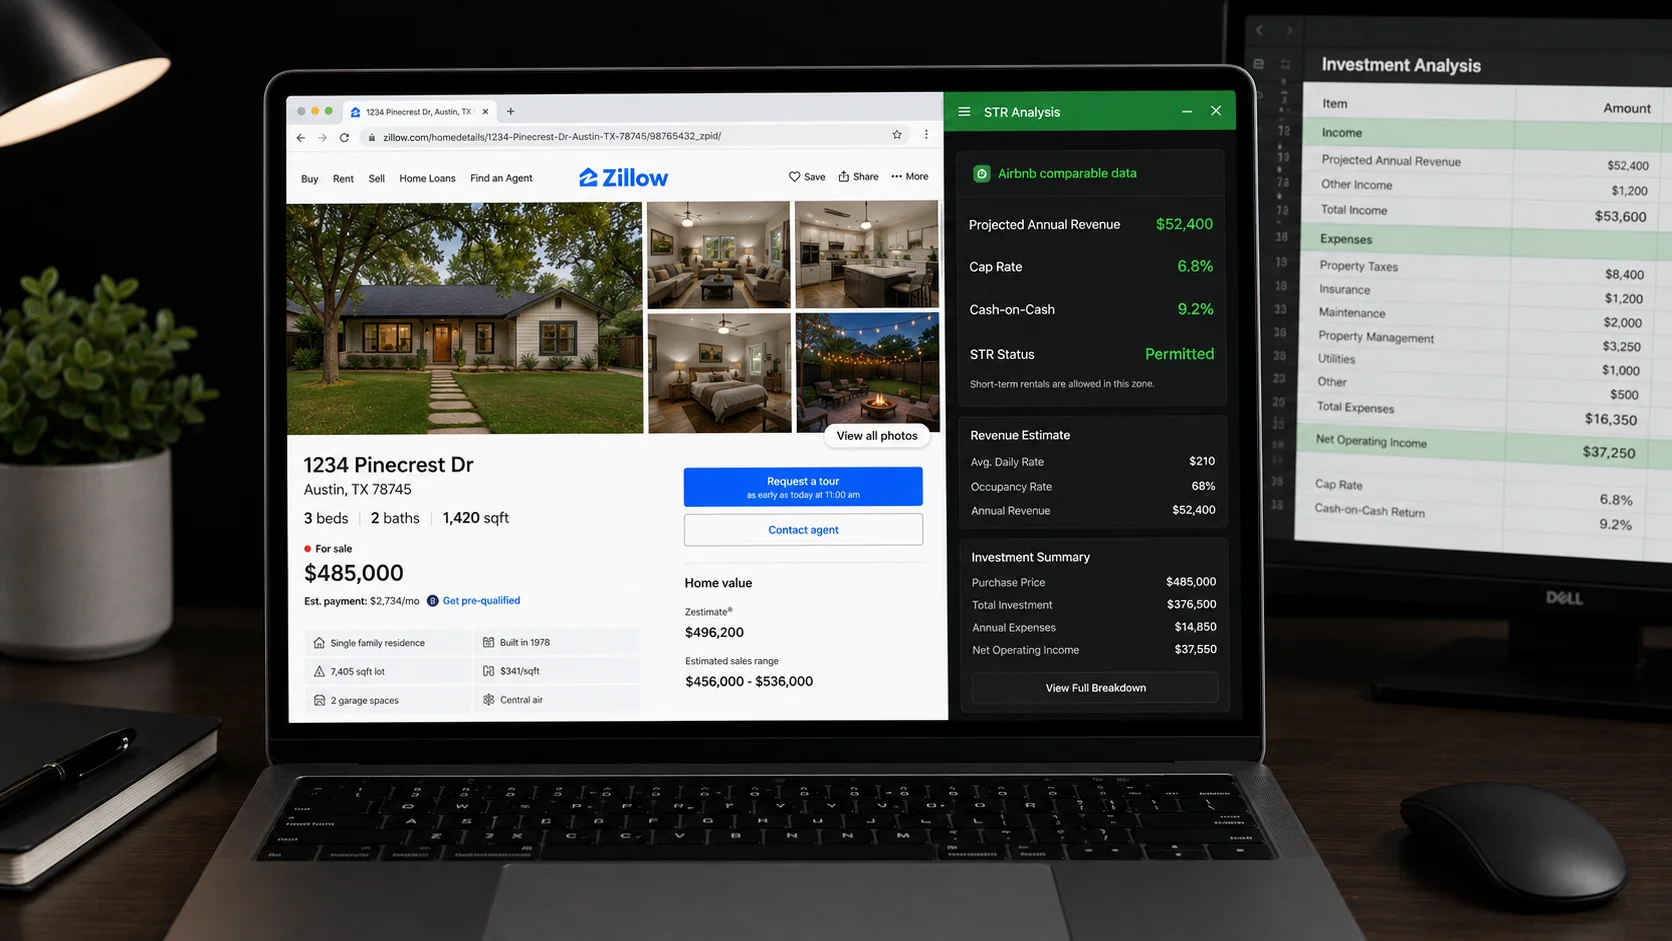
STRInvest is a Chrome extension that works directly on Zillow, Redfin, and Realtor.com listing pages. When you open any property listing, it shows the STR investment metrics for that specific property in the browser side panel.
What it calculates:
- Projected Airbnb revenue — based on live Airbnb data for similar properties in the same zip code and bedroom count (5 search windows averaged: 3 weekends + 2 midweek periods)
- Cap rate — using the listing price, projected revenue, and a 35% expense ratio
- Cash-on-cash return — with your down payment input and 30-year mortgage math at current rates
- Local STR regulations — covers 97 U.S. cities, shows night caps, permit requirements, and owner-occupancy rules
- Adjustable inputs — override the estimated nightly rate with real AirDNA or Rabbu data if you have it
Occupancy = 68% (national STR average — adjustable)
Gross Revenue = ADR × 0.68 × 365 ÷ 12
Expense Ratio = 35% (covers cleaning, platform fees, utilities, insurance, maintenance)
Net Operating Income = Gross Revenue × (1 − 0.35)
Best for: Investors who find properties on Zillow and need deal-level metrics fast. Compresses what used to take 30+ minutes of spreadsheet work into under 60 seconds.
Pricing: Free (3 analyses/month), Pro at $9.99/month for unlimited analyses + CSV export.
Limitation: Deal-analysis only — not a market exploration tool. Use AirDNA or Mashvisor to identify which markets to search in, then use STRInvest to evaluate specific listings.
AirDNA — Market-Level STR Data
AirDNA aggregates Airbnb and Vrbo performance data across thousands of markets worldwide. It answers market-selection questions: What's the average occupancy in Nashville? What's the RevPAR (revenue per available room) trend in Scottsdale over the past 12 months? Which neighborhoods within Denver outperform the city average?
What it provides:
- Market-level occupancy, ADR, and revenue trends (monthly/annual)
- Neighborhood-level performance comparisons within a city
- Active listing counts and supply growth indicators
- Seasonality charts showing demand peaks and troughs
- MarketMinder: composite score for STR investment viability by market
Pricing: Free tier shows limited data. Paid tiers start around $12–24/month for basic access; full analytics run $90+/month. Data quality is strong but pricing is high for investors analyzing 1–2 markets.
Best for: Investors comparing multiple markets or neighborhoods before committing to a specific city. Less useful once you've selected a market and are evaluating individual deals — that's where STRInvest takes over.
Mashvisor — Neighborhood Exploration and Projections
Mashvisor integrates property listing data with neighborhood-level STR performance metrics. You can search for investment properties by city, filter by cash-on-cash return or cap rate, and see projected rental income alongside traditional rental comparisons.
What it does well:
- Side-by-side STR vs. long-term rental comparison for any property
- Heatmap view of neighborhood investment scores within a city
- Cash-on-cash return filters for portfolio prospecting
- Integration of property listings + rental projections in one interface
Pricing: Starts at $49/month for the Lite plan; Quarterly and Annual plans reduce the per-month cost.
Best for: Investors who want a map-based interface for exploring which neighborhoods within a city show the strongest STR returns. Less useful for deep due diligence on a specific property you've already found.
Mashvisor vs. STRInvest: Mashvisor is a market exploration tool you use to find areas worth targeting. STRInvest is a deal evaluation tool you use when you've already found a specific property on Zillow or Redfin. They serve different phases of the investment process and can be used together.
BiggerPockets — Community and Free Calculators
BiggerPockets is the largest real estate investing community online. For STR investors, it offers three valuable resources: deal calculators, a forum with specific STR discussion threads, and a rental property database with community-submitted performance data.
Free tools:
- Rental Property Calculator — comprehensive cash flow analysis with mortgage, taxes, insurance, CapEx, and vacancy
- BRRRR Calculator — useful for investors using the buy-renovate-rent-refinance-repeat strategy on STR properties
- Short-Term Rental Calculator — available to Pro members; models Airbnb income with seasonal adjustments
Community value: The STR forums are full of investors who have done this before — specific market recommendations, vendor referrals for property management, and real data points from active hosts. The community knowledge often fills gaps that paid tools miss.
Pricing: Free tier gives access to calculators and forums with limits. Pro is $39/month with unlimited calculator access and premium content.
Free Tools Every STR Investor Should Use
Several powerful research resources are completely free and often overlooked:
STRInvest (Free Tier)
3 free analyses per month on any Zillow or Redfin listing. For investors in the early screening phase, 3 analyses/month is enough to evaluate the best candidates before subscribing to Pro for unlimited access.
Airbnb's Own Search Results
The most underused free tool in STR investing. Search Airbnb for your target city, filter by bedroom count matching your target property, and sort by "Rating." The results show real competing listings, their prices, and their booking calendars (occupancy proxy). This is live market data from the primary source — no subscription required.
County Assessor / Property Records
Every U.S. county publishes property ownership records, assessed values, and tax history online for free. Before buying any STR investment, verify the current owner, the purchase price and date (reveals equity position), and any open liens. County recorder sites vary in quality but all are free.
Local STR Regulation Research
Many cities publish their STR permit rules on official city websites. STRInvest covers 97 cities with built-in regulation data, but for other cities, search "[city name] short-term rental permit" to find the official ordinance. Understanding night caps, owner-occupancy requirements, and permit costs before purchasing is non-negotiable due diligence.
FEMA Flood Map Service Center
msc.fema.gov lets you search any U.S. address for its flood zone status. Properties in FEMA flood zones require separate flood insurance, which can add $1,000–$4,000/year to expenses and significantly impact your cash-on-cash return. Free to check before making any offer.
The Complete STR Deal Analysis Workflow
Combining these tools into a systematic workflow turns STR deal analysis from a time-consuming manual process into a repeatable 15–30 minute evaluation per property:
Market Selection (AirDNA or Mashvisor)
Identify 2–3 target markets with strong STR demand indicators: occupancy 60%+, ADR trend positive or stable, active listing growth not outpacing demand. Set up Zillow saved searches for each target market.
Initial Deal Screen (STRInvest)
As new listings appear in your saved searches, open each one and run STRInvest. Takes 60 seconds. Any property with a projected cap rate below 6% or negative cash-on-cash at your down payment amount gets filtered immediately. Short-list properties that show 8%+ cap rate and positive cash flow.
Regulation Check (STRInvest + Local Research)
For short-listed properties, verify the STR regulatory status. STRInvest shows night caps and permit requirements for 97 cities. For cities not covered, check the city's official website. Eliminate any property in a city with a ban or permit freeze.
Revenue Validation (Airbnb Search)
Search Airbnb directly for properties matching your target's location and bedroom count, 4 upcoming weekends. Does the comp pricing match what STRInvest projected? Check booking calendars on 5–10 comparable listings — what occupancy do they appear to have? If comps are pricing lower than STRInvest's projection, adjust your revenue estimate down.
Full Cash Flow Model (BiggerPockets Calculator or Spreadsheet)
Input your specific mortgage terms, exact down payment, tax rate (from county assessor), insurance quote, and validated revenue estimate. Model at 65%, 70%, and 75% occupancy to see the cash flow range. If the pessimistic case (65% occupancy) still shows positive cash flow, the deal is worth serious consideration.
This workflow compresses what previously required hours of manual research into a systematic process that filters most properties in under 5 minutes and produces a reliable financial model in 30 minutes for the ones that pass initial screening. The right tools at each stage make every step faster and more accurate.
For deeper analysis on specific metrics, see cap rate vs. cash-on-cash return for STR properties and how to analyze an STR investment on Zillow.